
Introduction
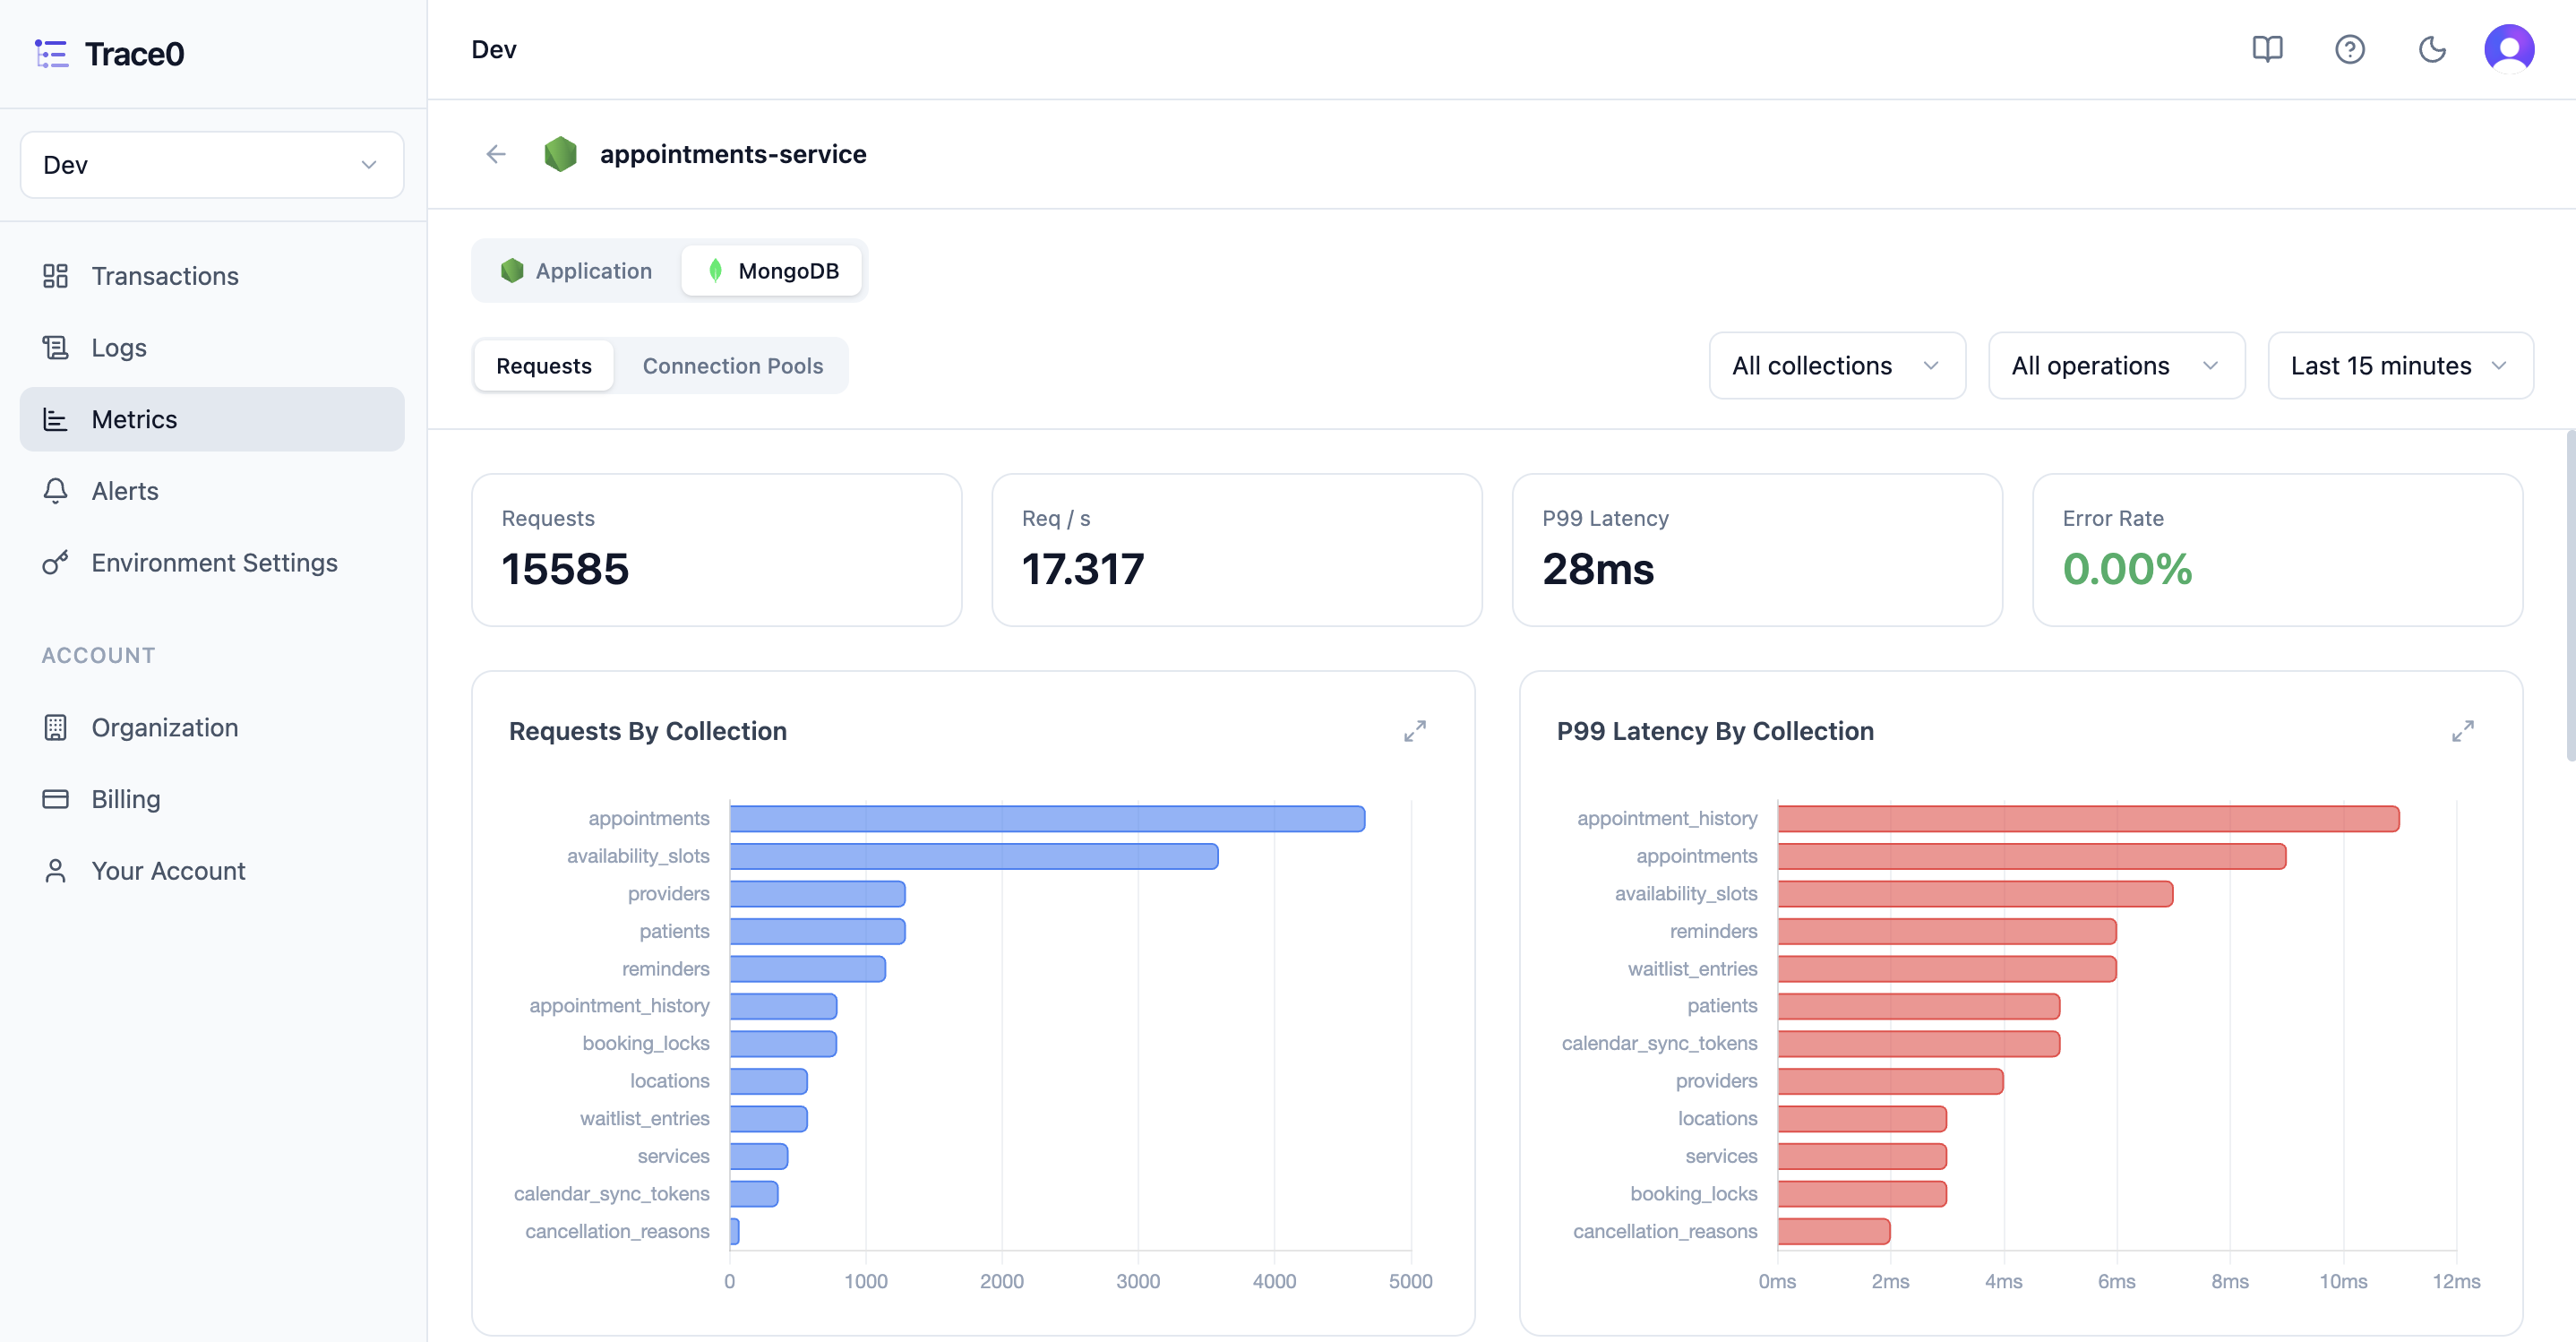
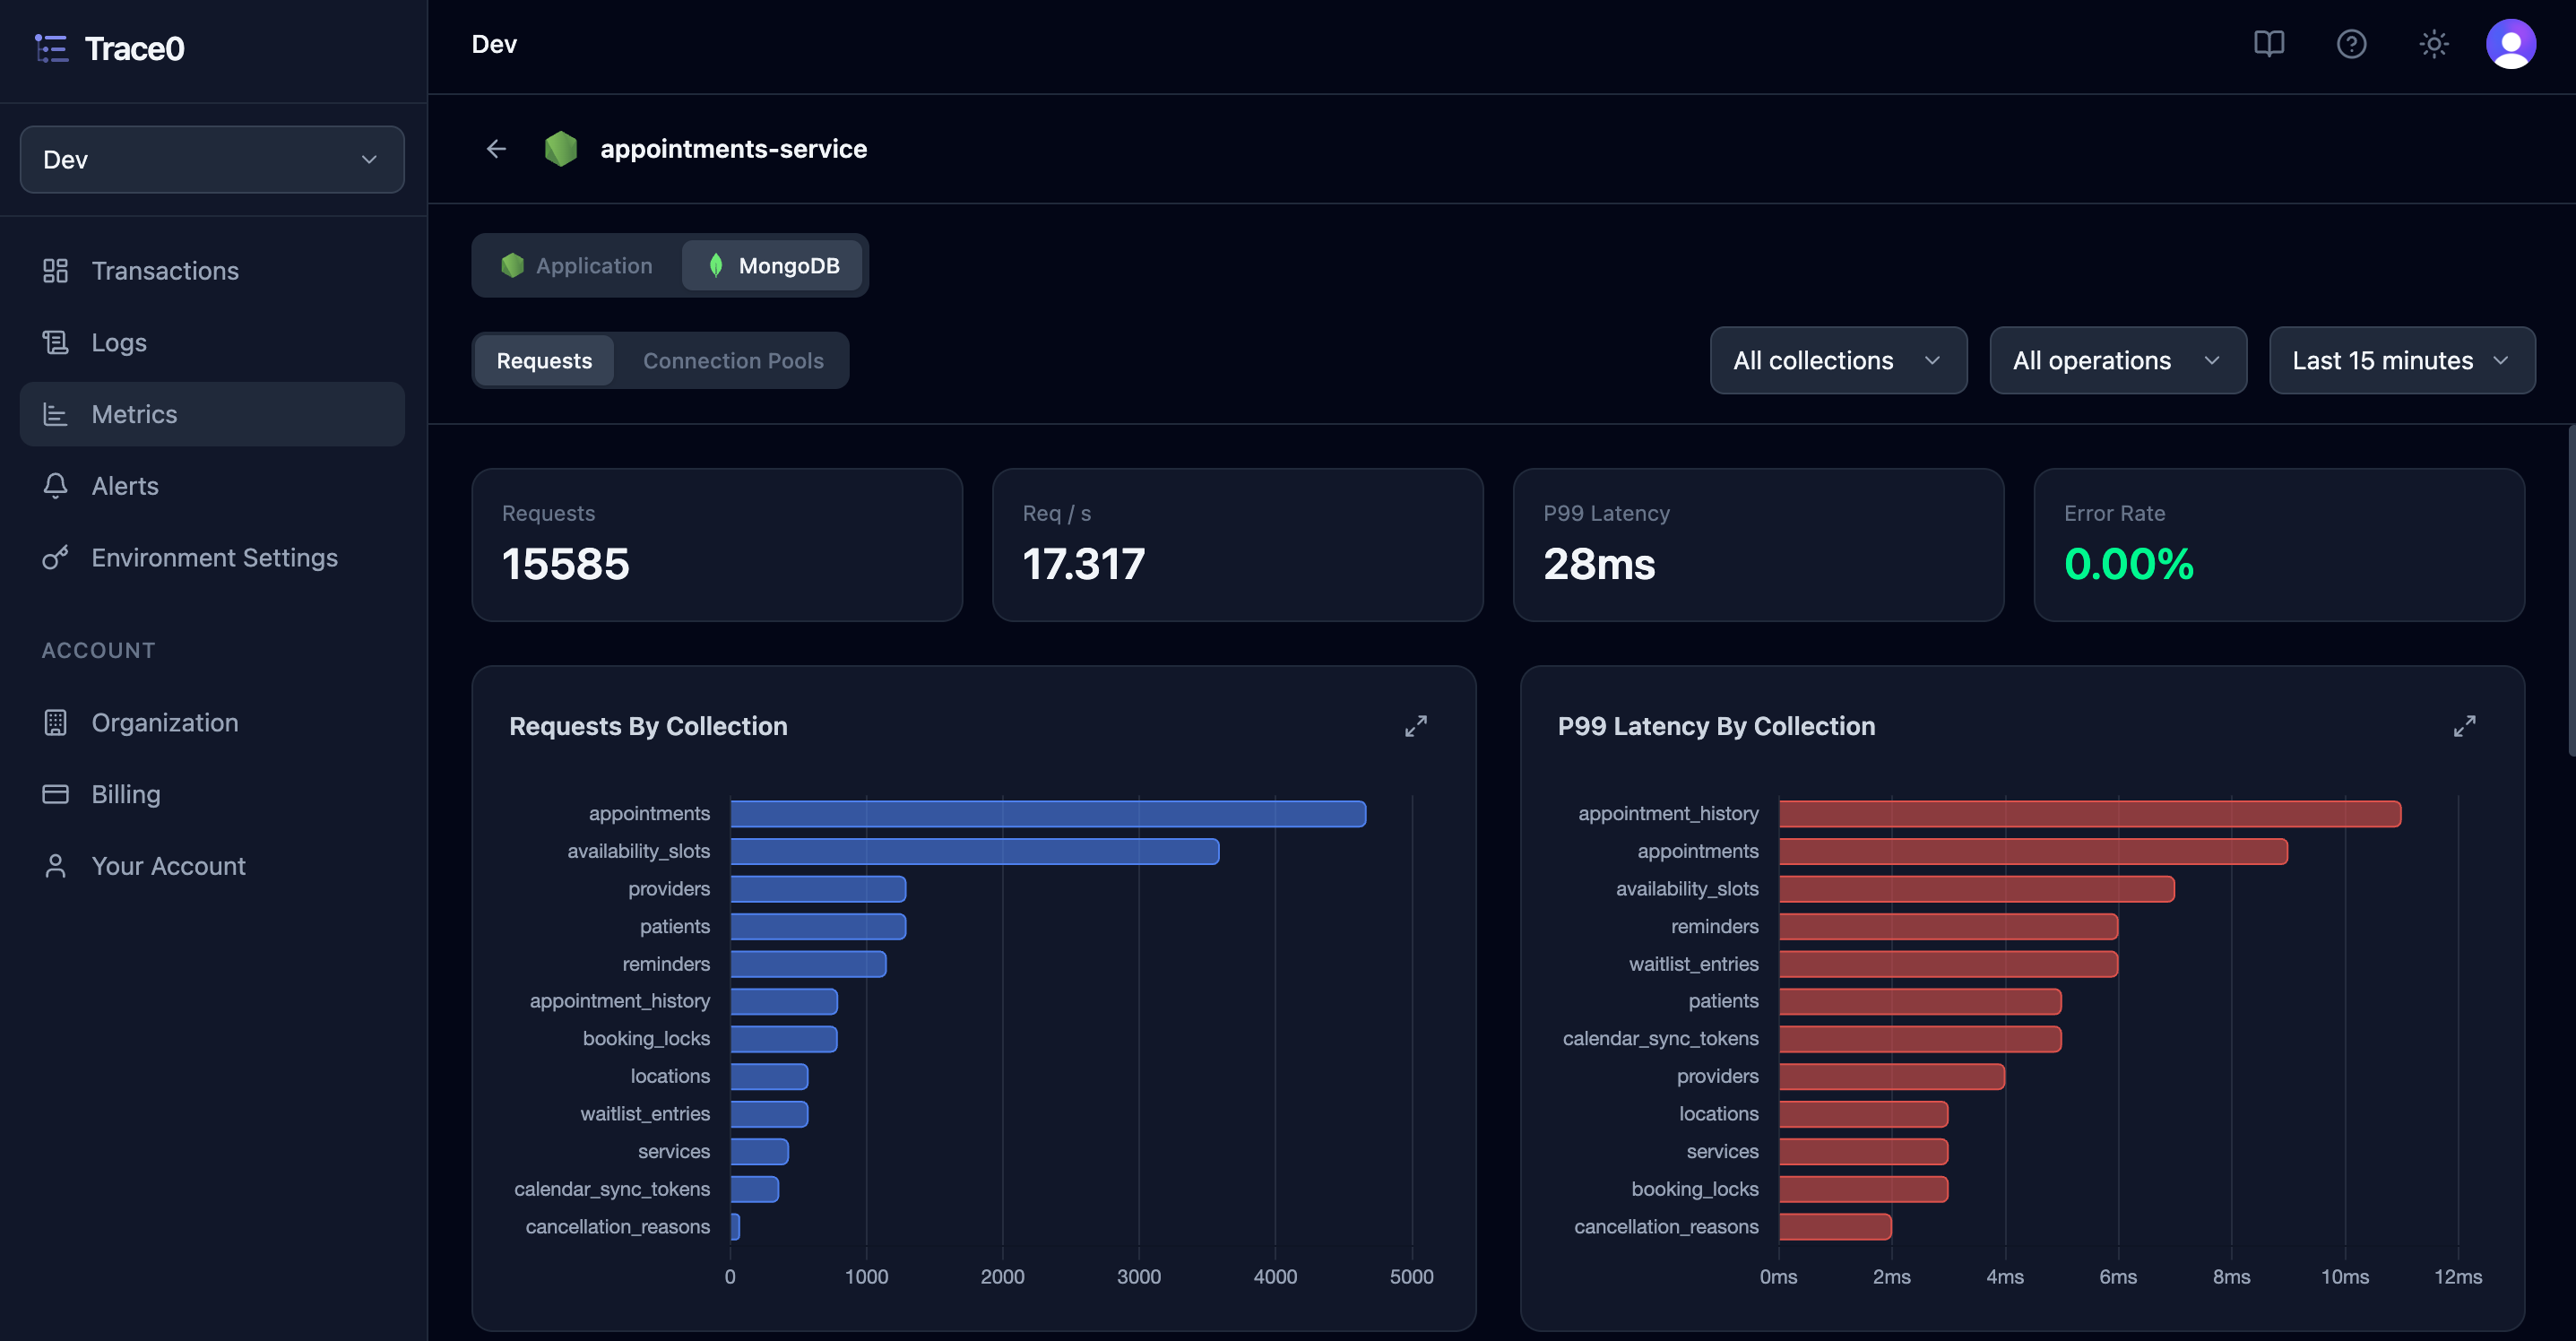
Trace0 provides detailed metrics for MongoDB, based on the OpenTelemetry semantic conventions for client operations. To view metrics for MongoDB for a service, click into the Metrics section, click theView more link for your service, then click the MongoDB toggle.
Displayed Metrics
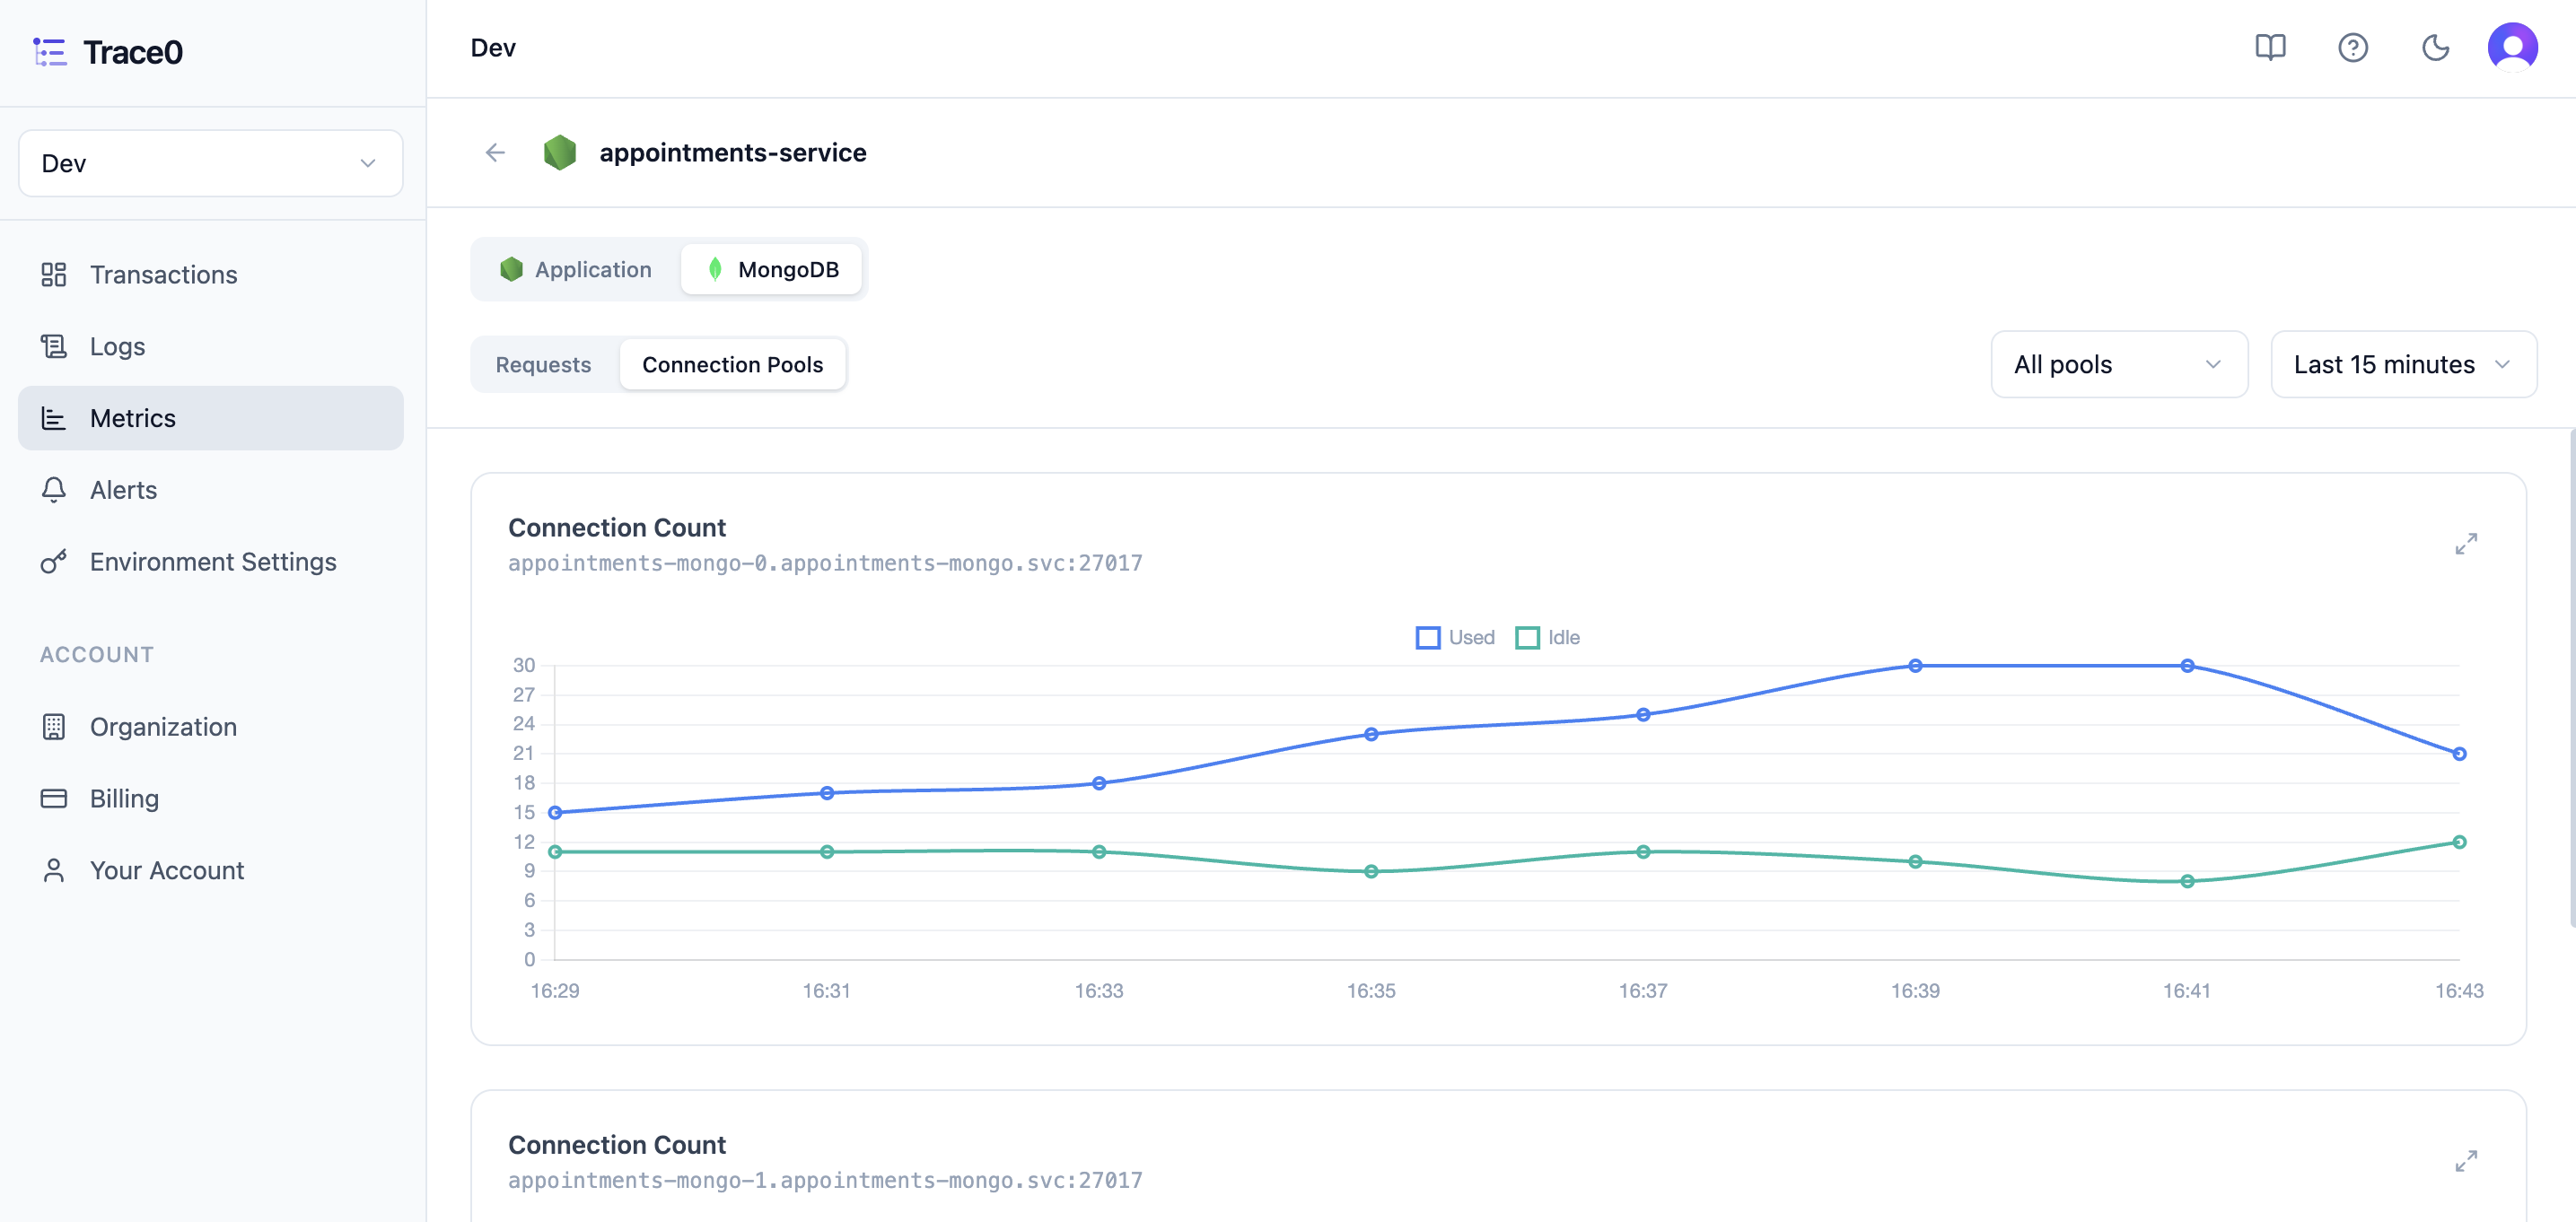
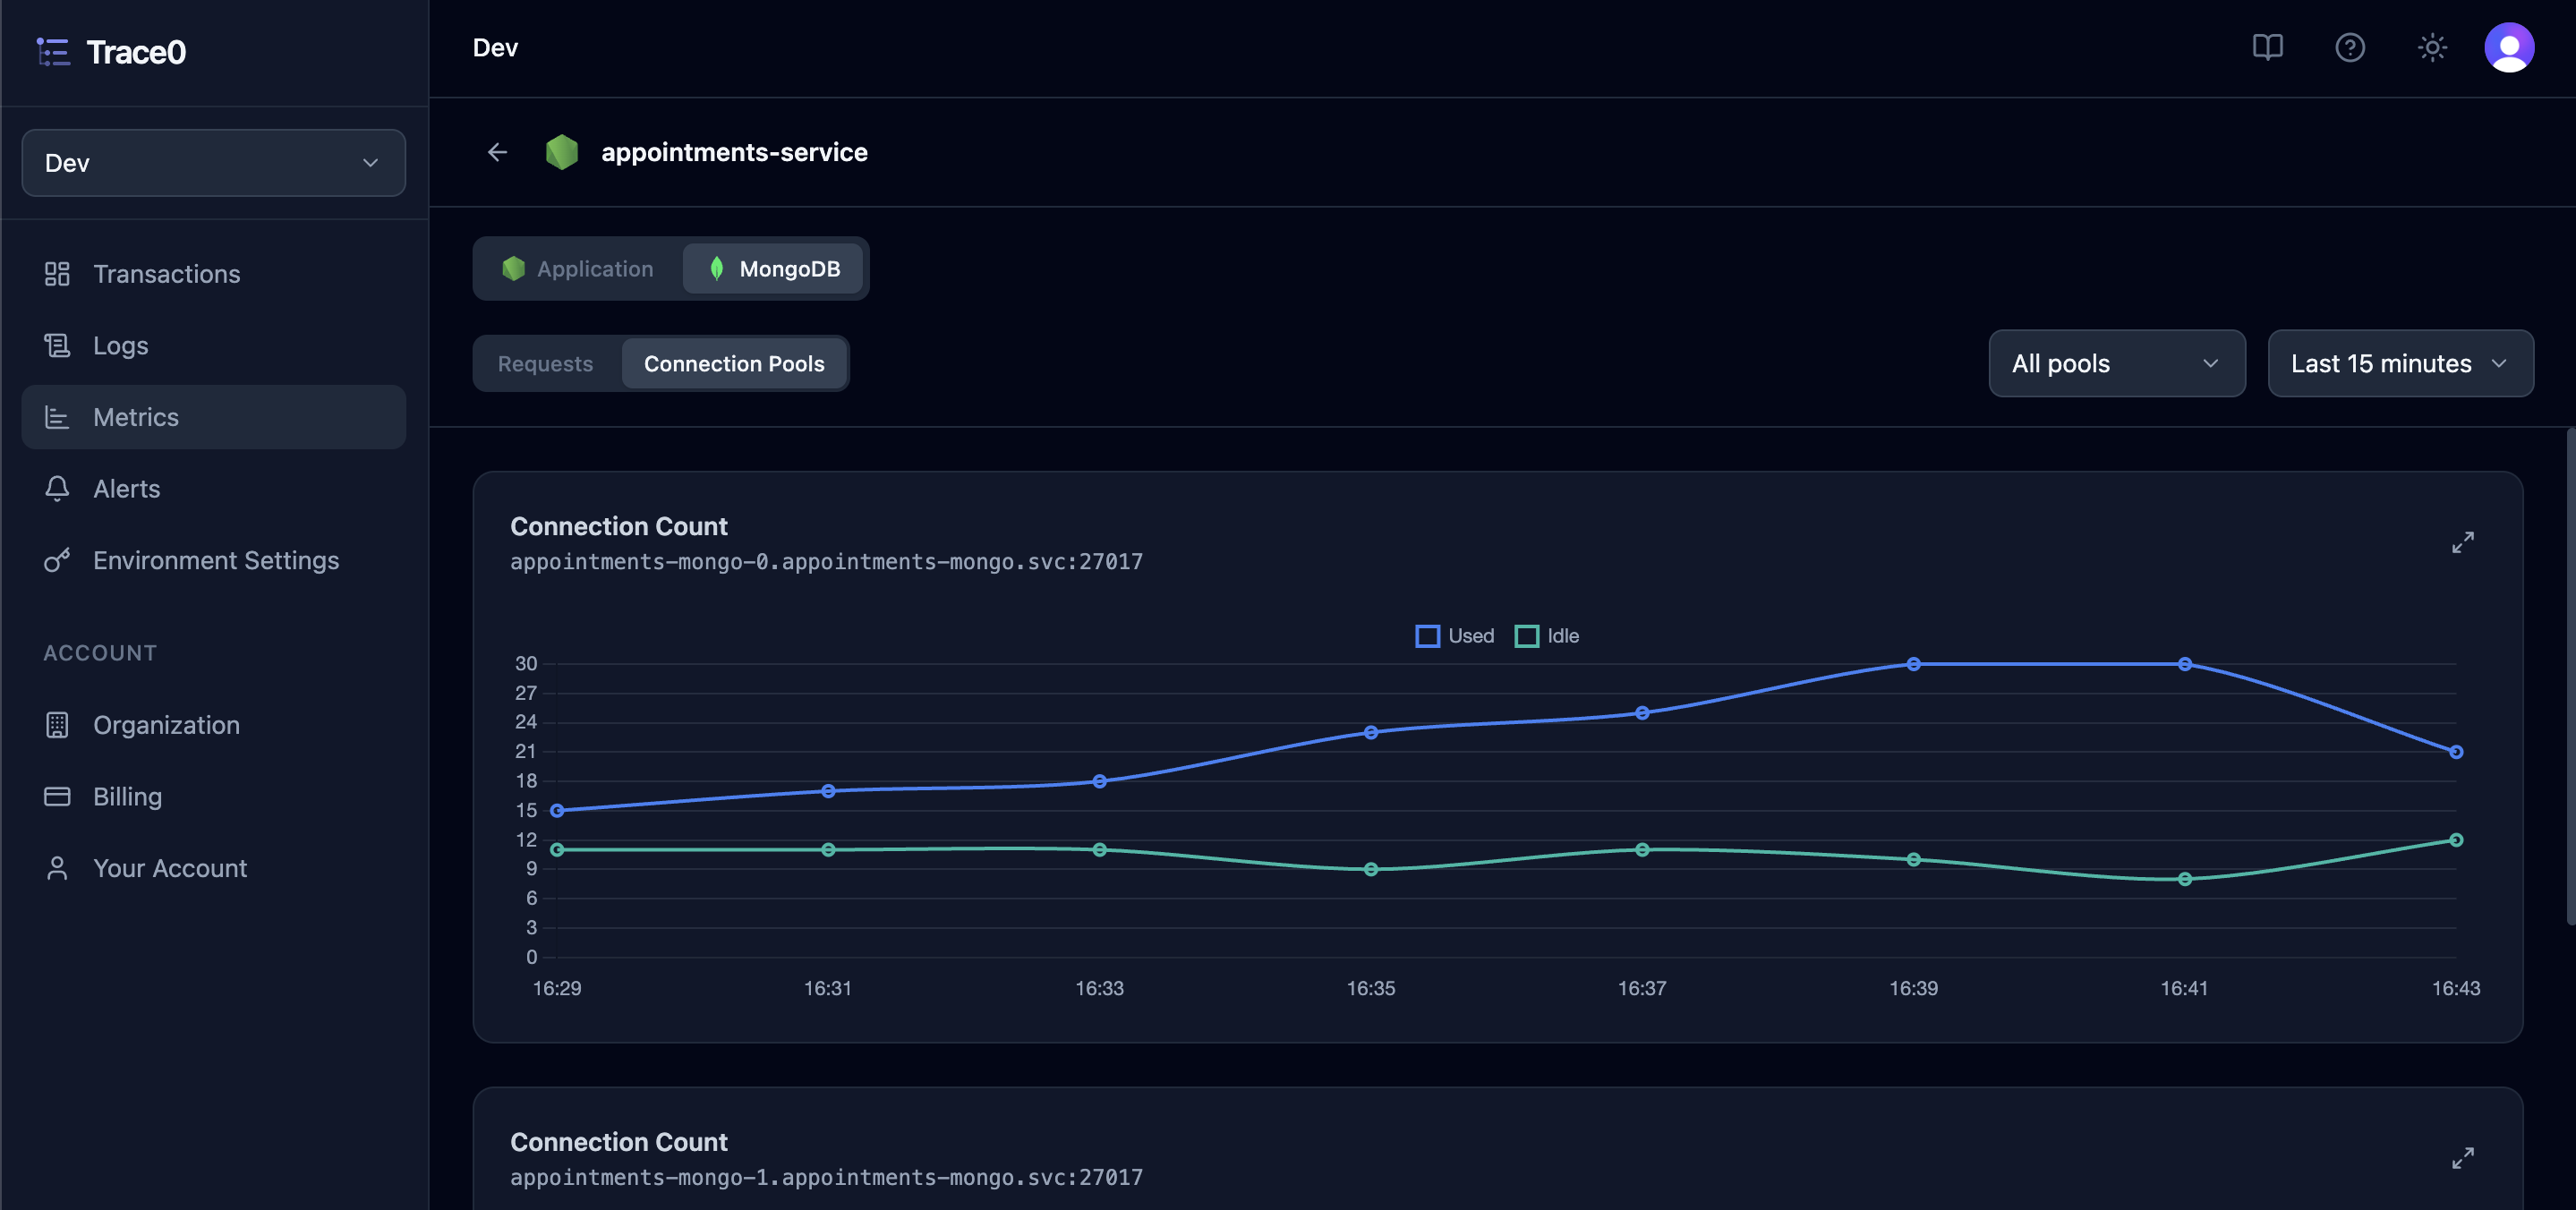
We currently display the following MongoDB metrics, broken intoRequests and Connection Pools sections.
The metrics are displayed either as a single value or as a chart.
- Requests
- Connection Pools
Single Value
Chart