Setup
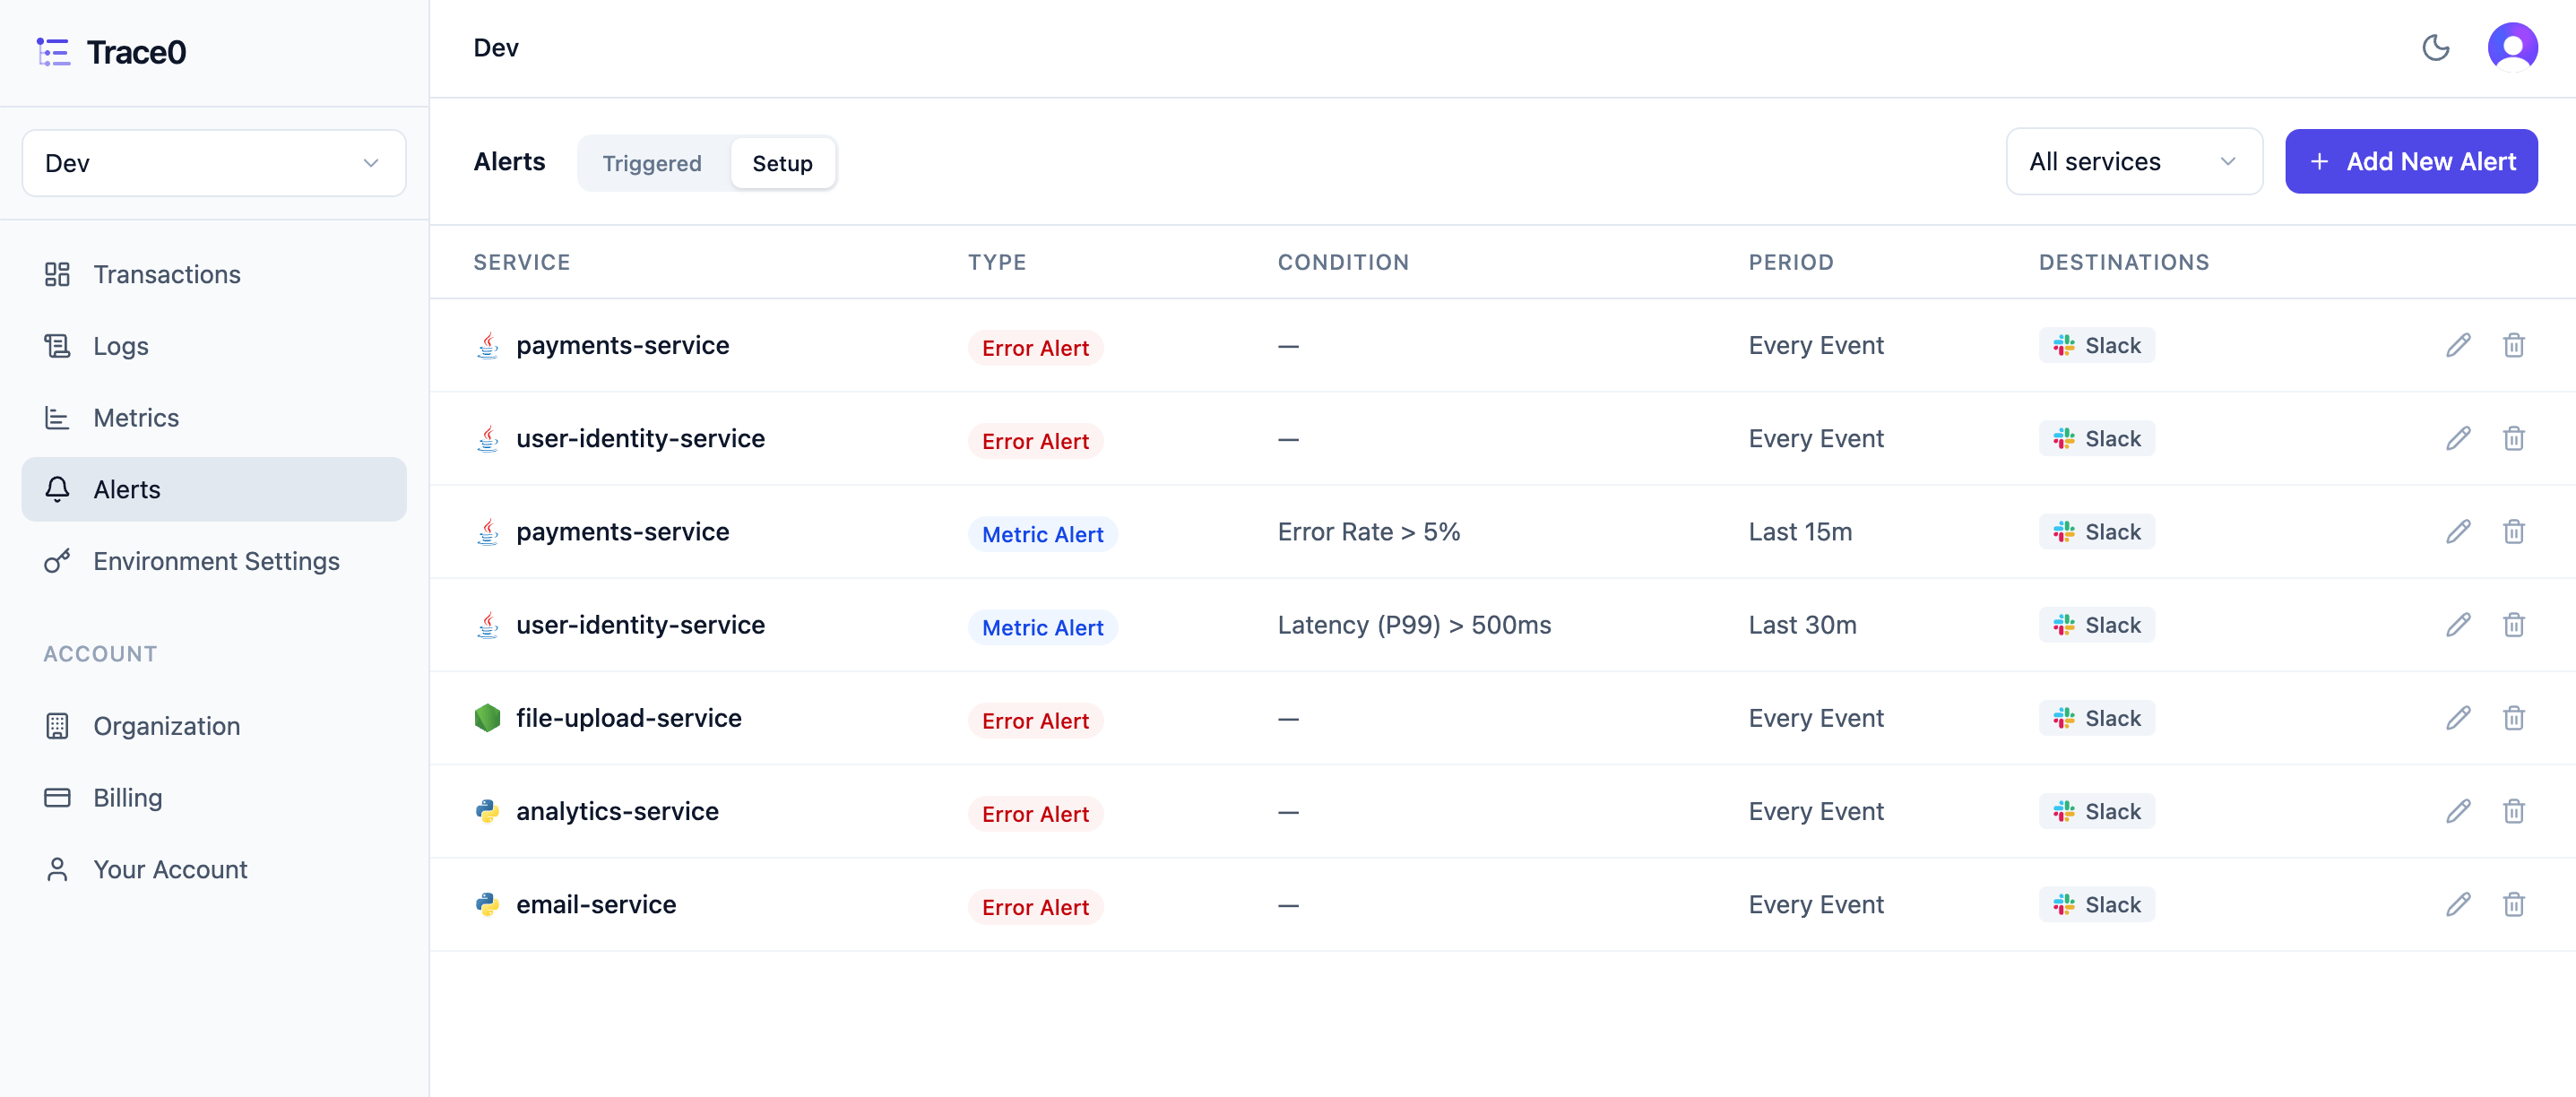
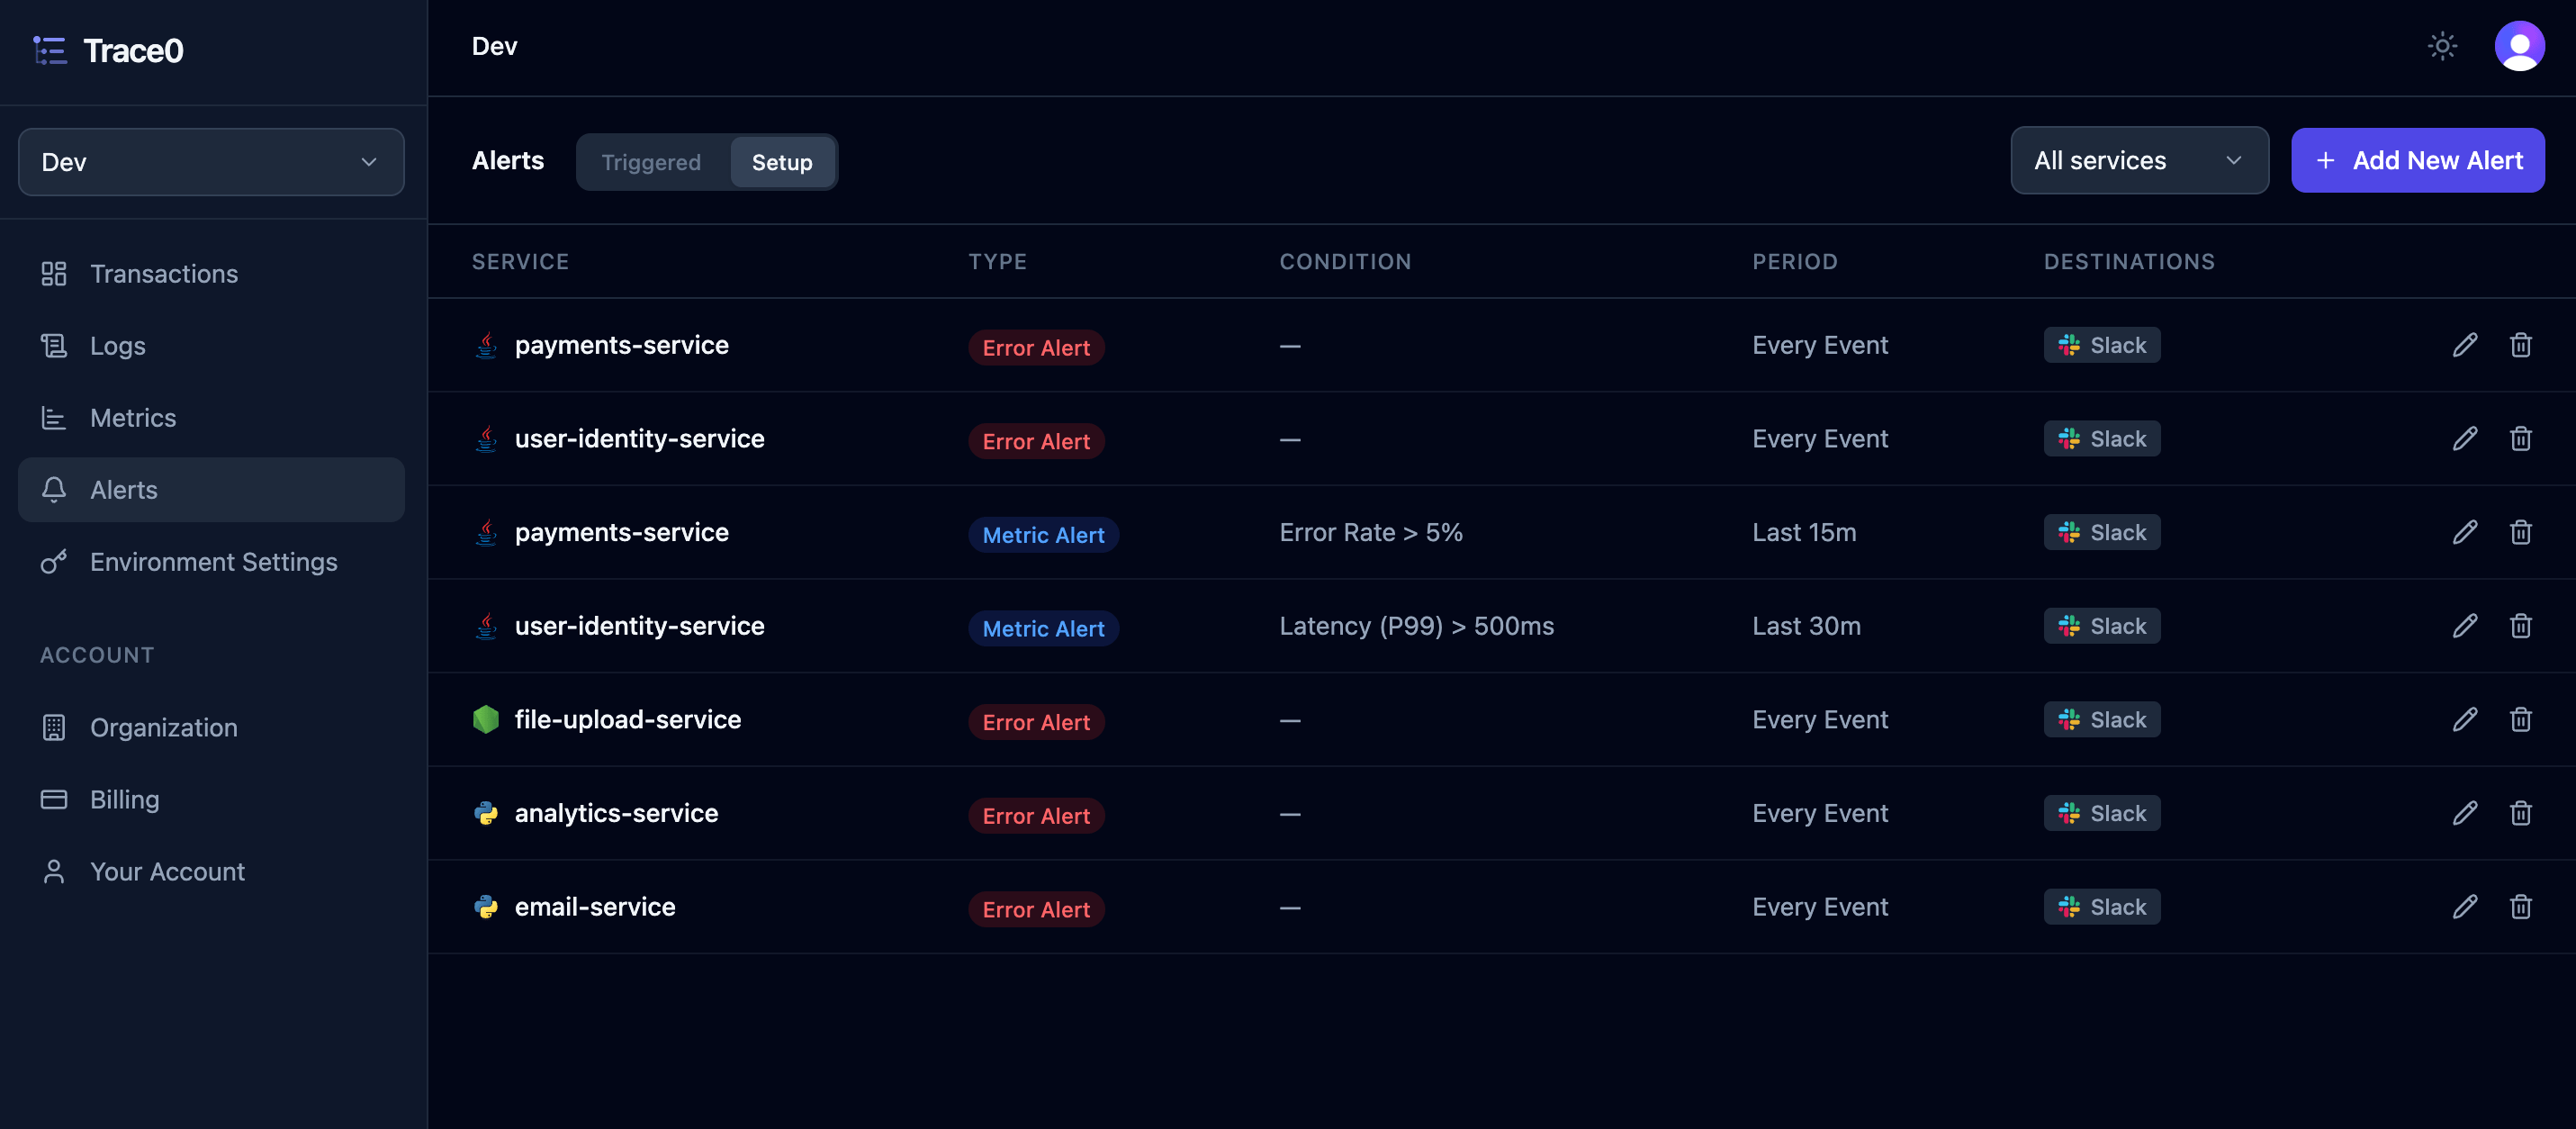
In Trace0, you can set alerts for both errors and metrics thresholds. To create a new alert, head to the Alerts section and click theAdd New Alert button:
Error Alerts
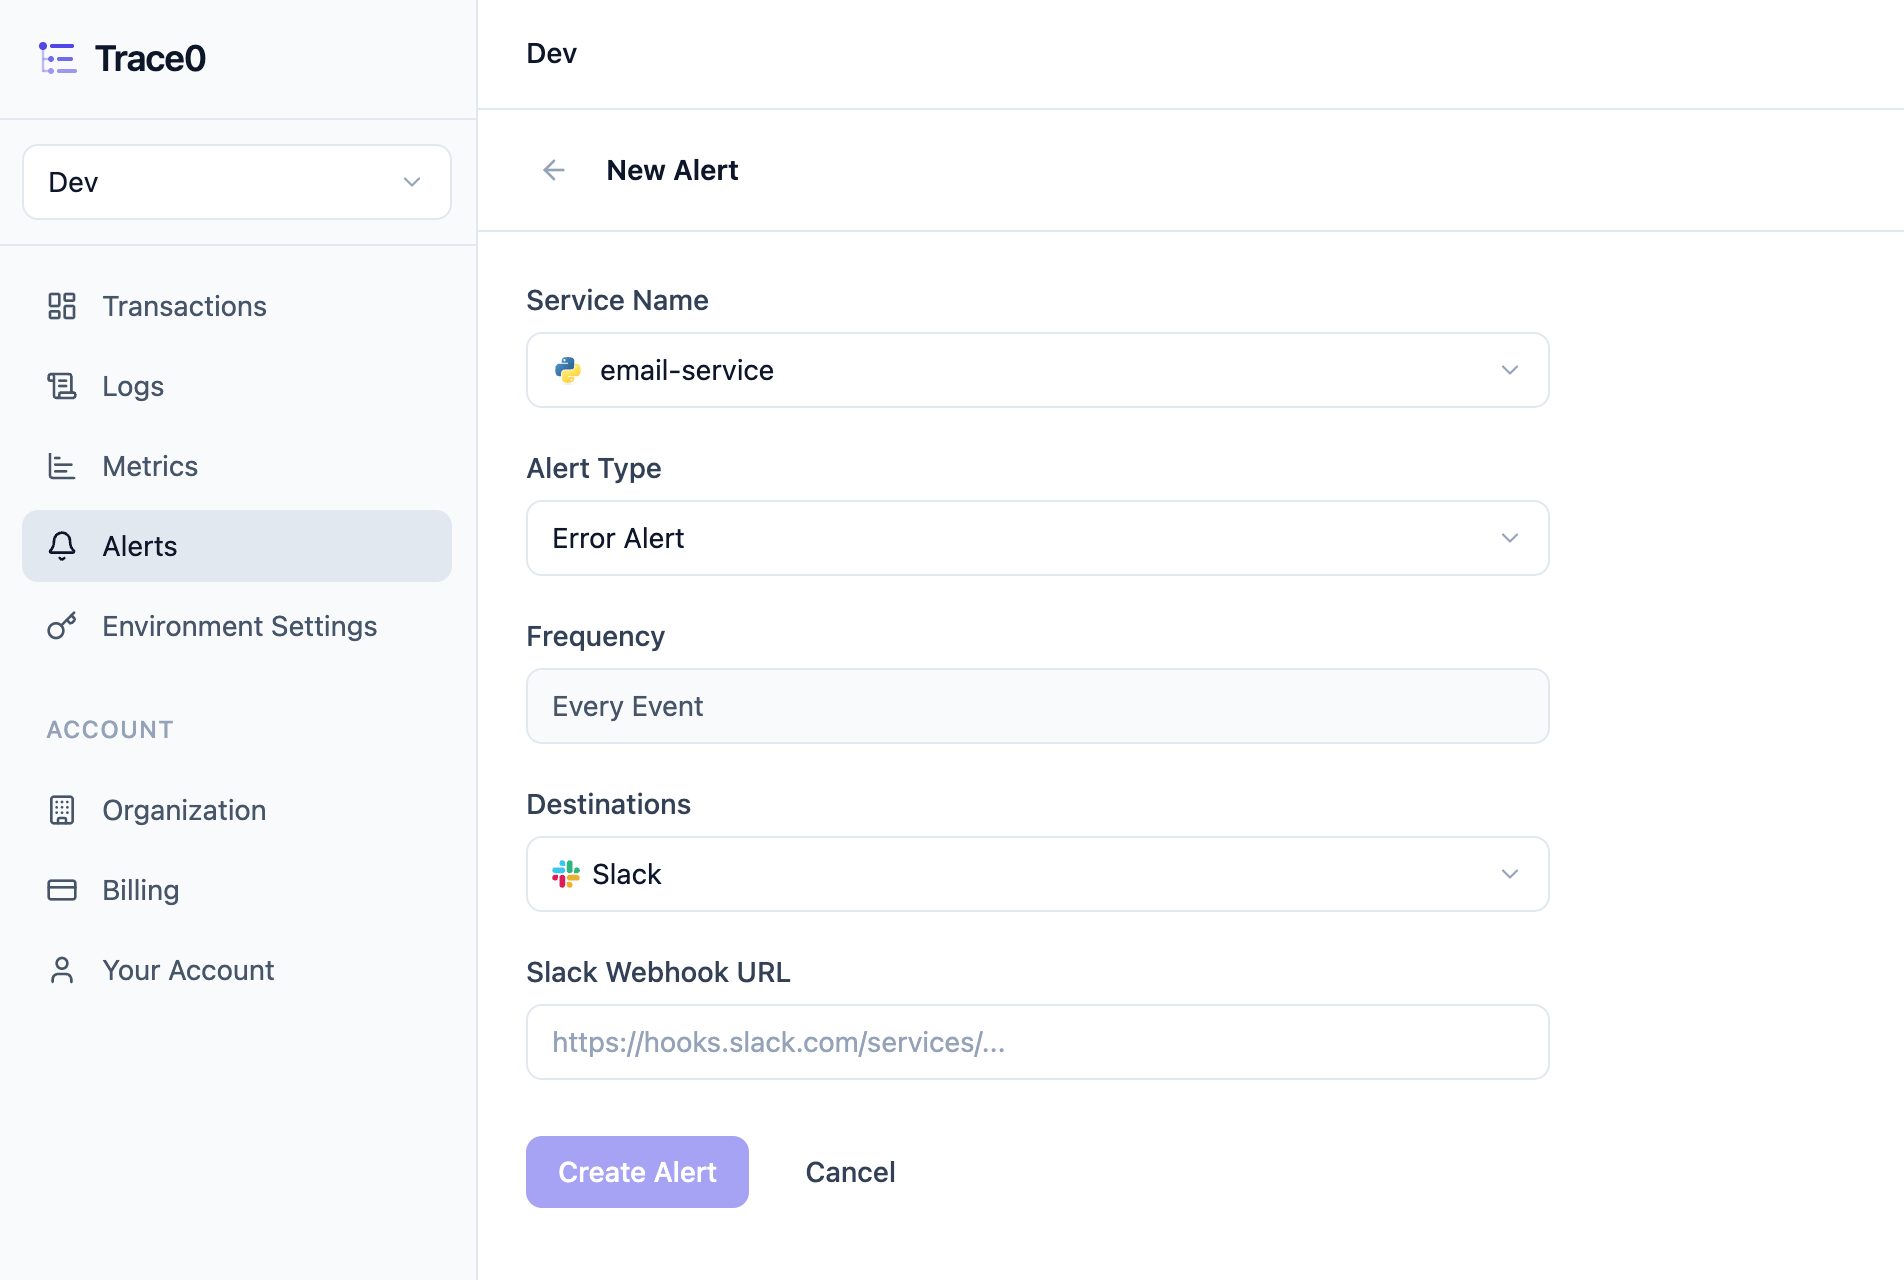
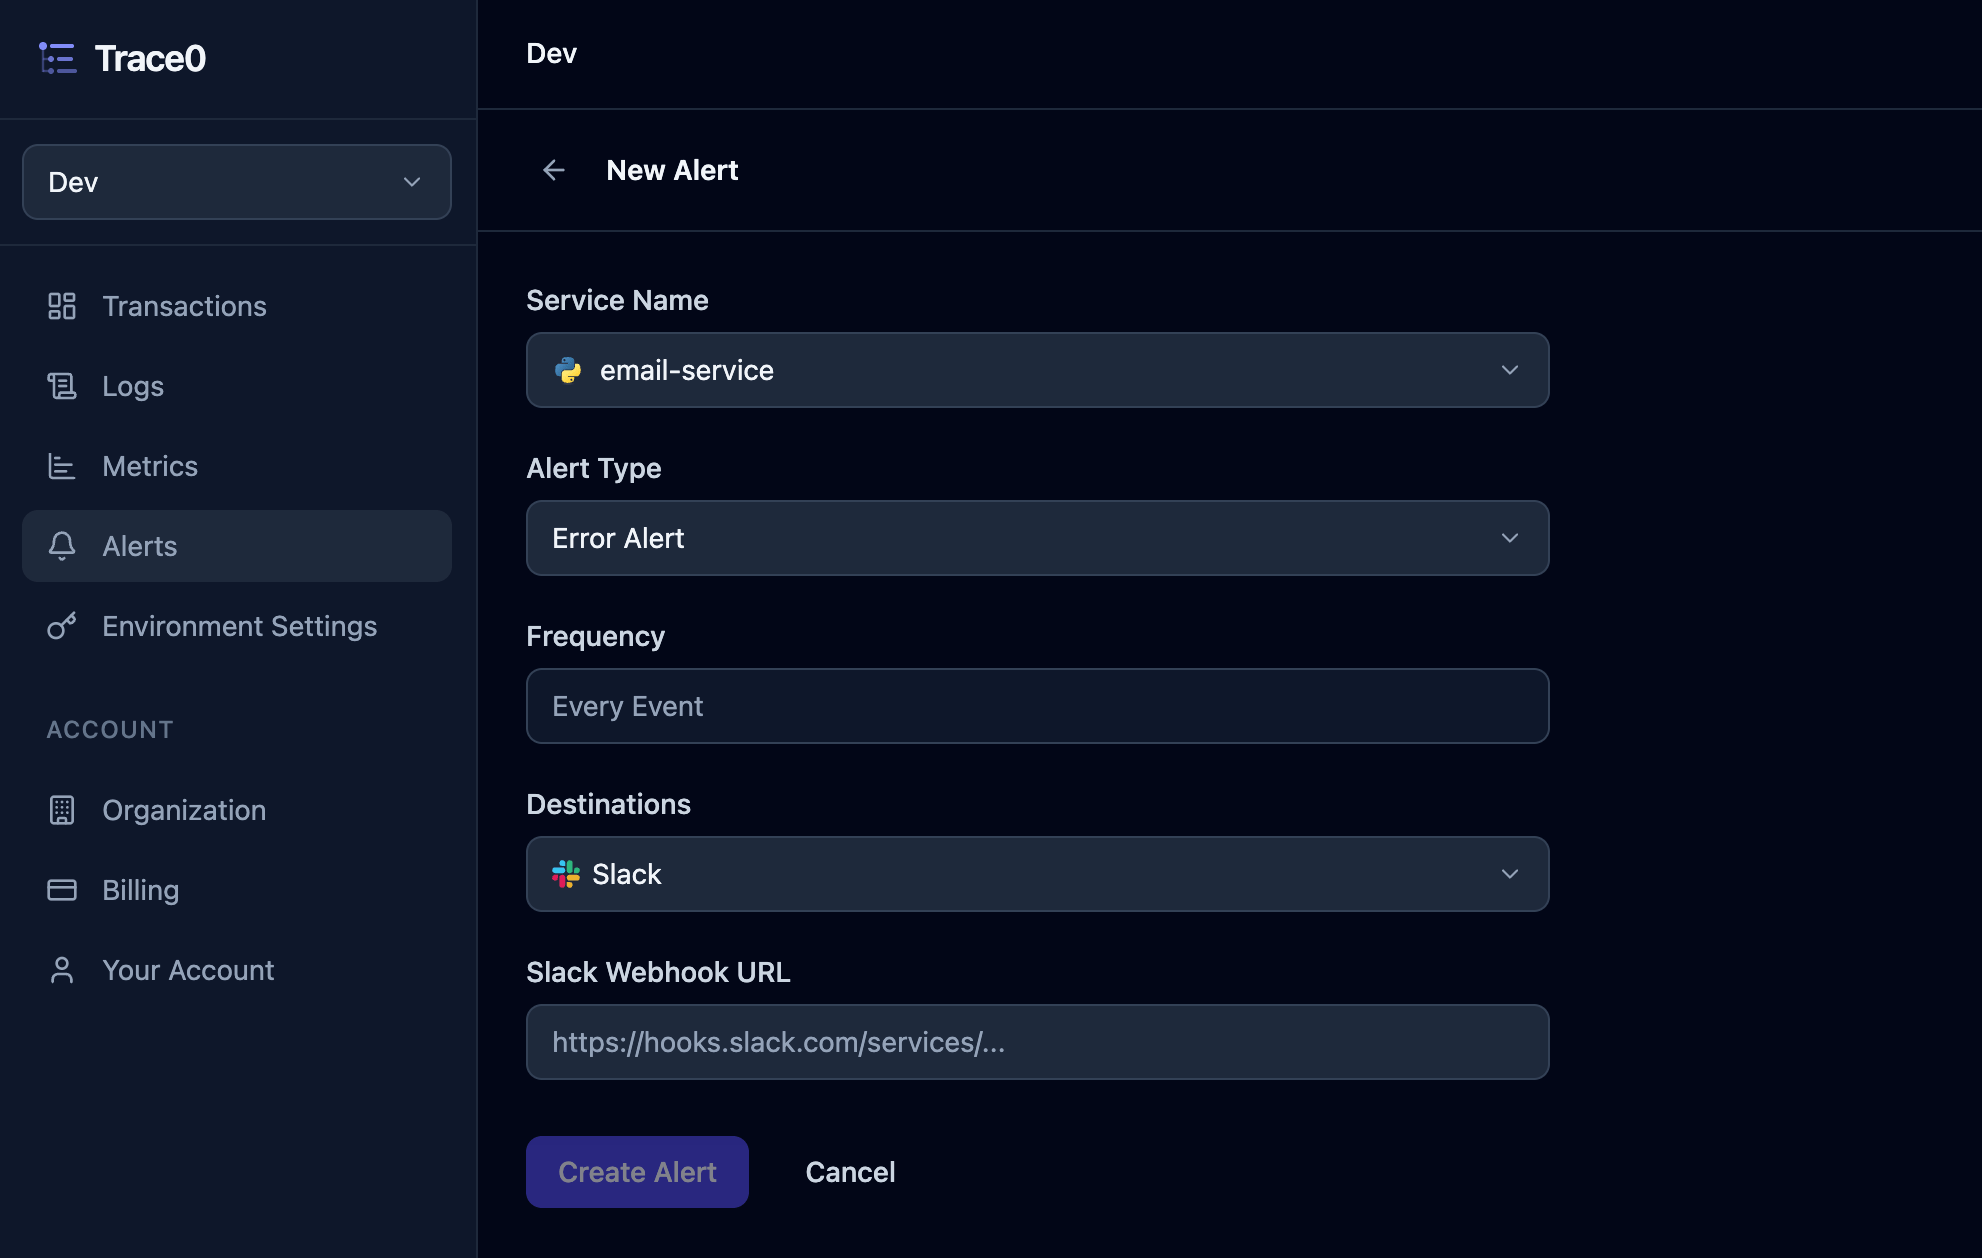
For error alerts, the frequency is automatically set toEvery Event, meaning you will receive an alert each time a request to your service fails.
You can then set a Destination — Slack, Email, or both.
- If you select
Email, enter the email address you want to receive alert notifications. - If you select
Slack, enter the Webhook URL for the channel you want to receive alert notifications.
Metric Alerts
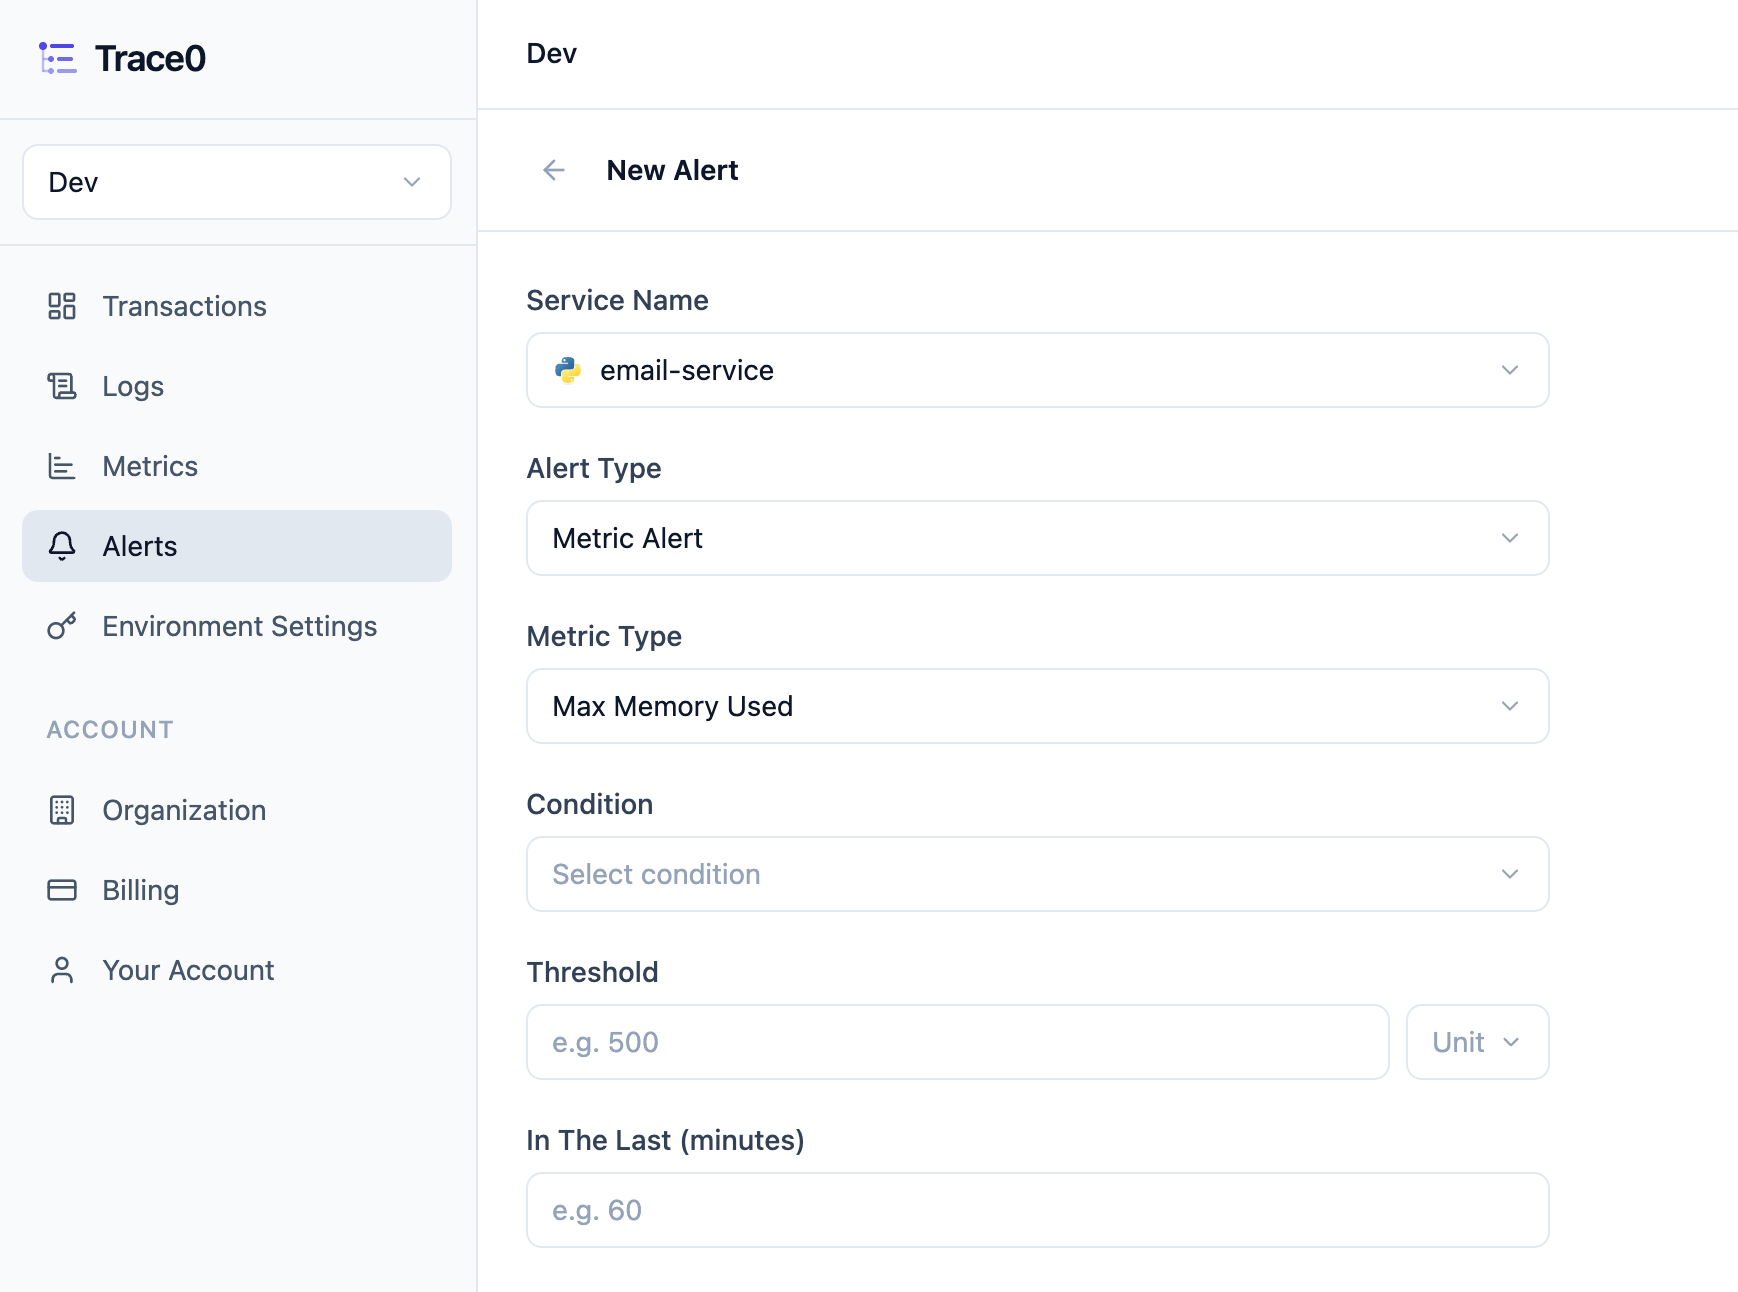
For metric alerts, you first select theMetric Type — Request Latency, Error Rate or Max Memory Used. Each type is explained in further detail below:
- Request Latency
- Error Rate
- Max Memory Used
For Request Latency alerts, you can set the following parameters: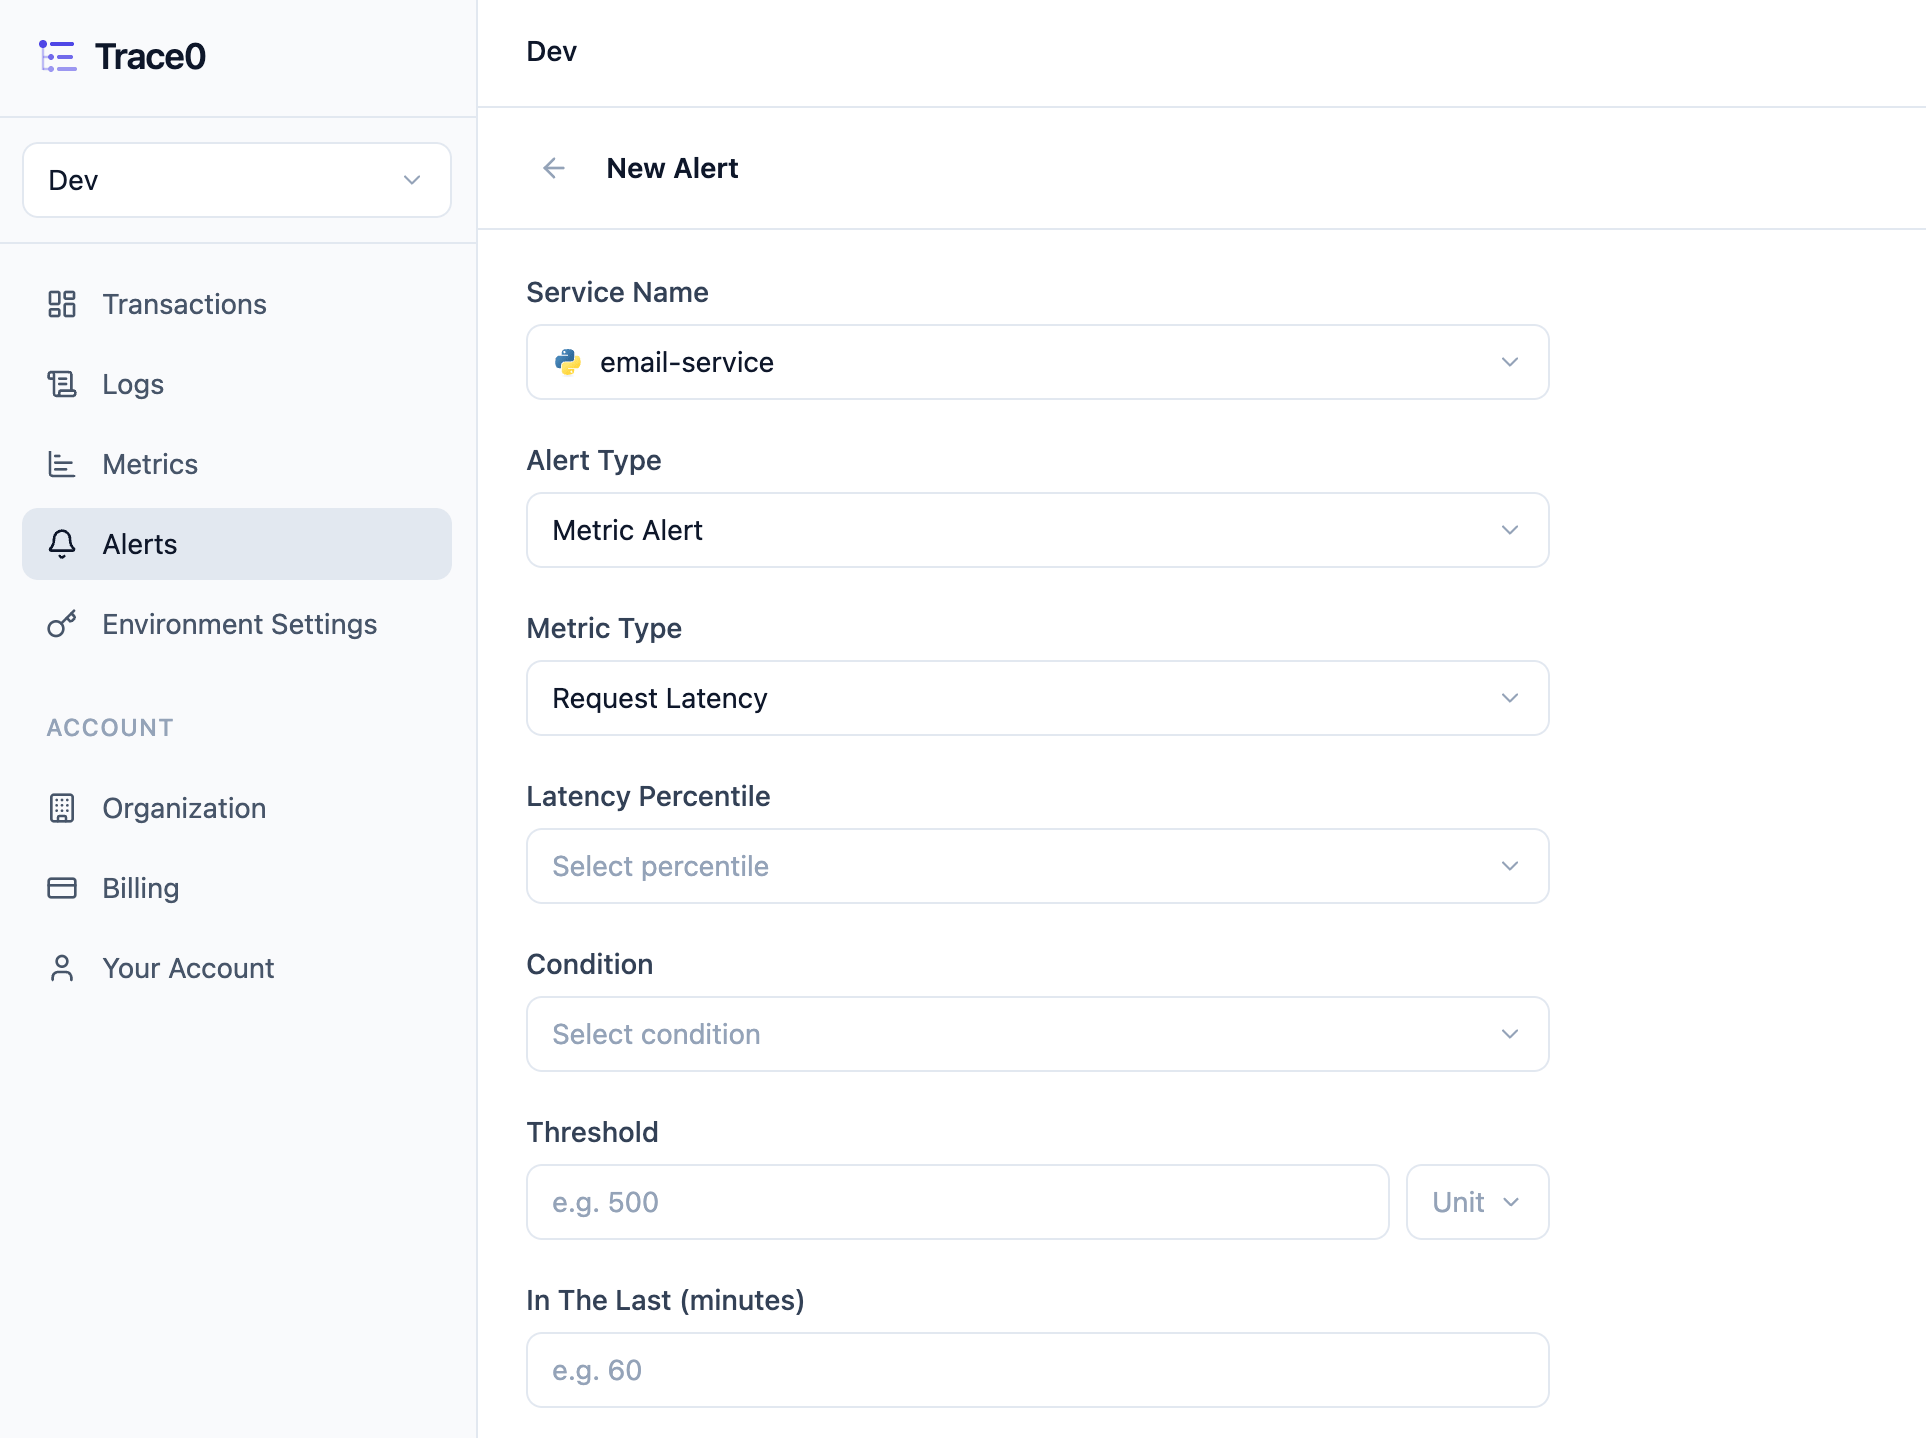
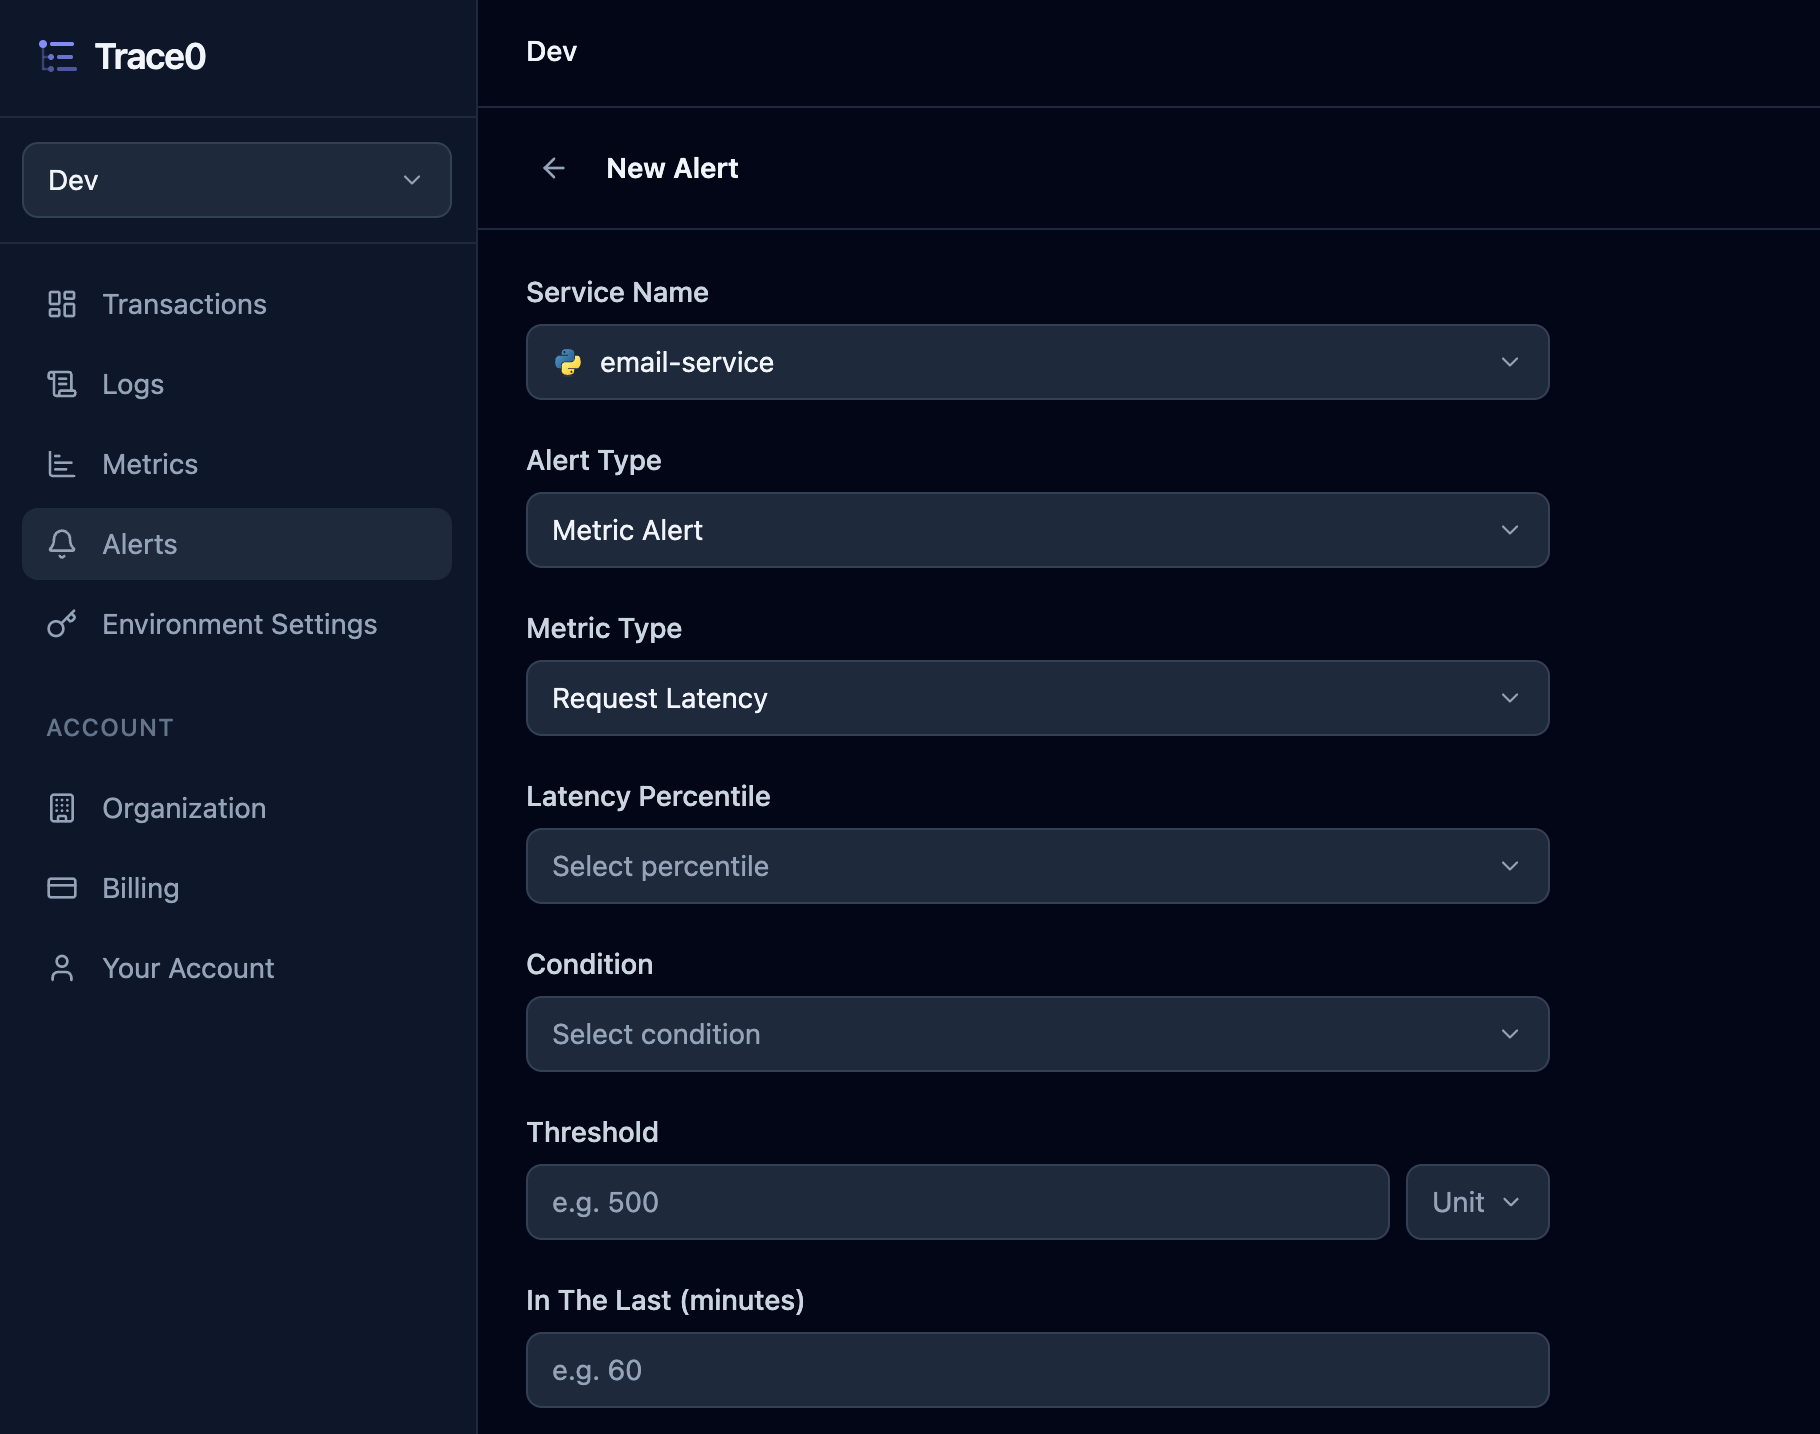
Latency Percentile— P99, P95, P90, P75, P50Condition— Greater than, Greater than or equals, Less than, Less than or equals, EqualsThreshold— A number in either milliseconds or secondsOver The Last (minutes)— A number in minutes
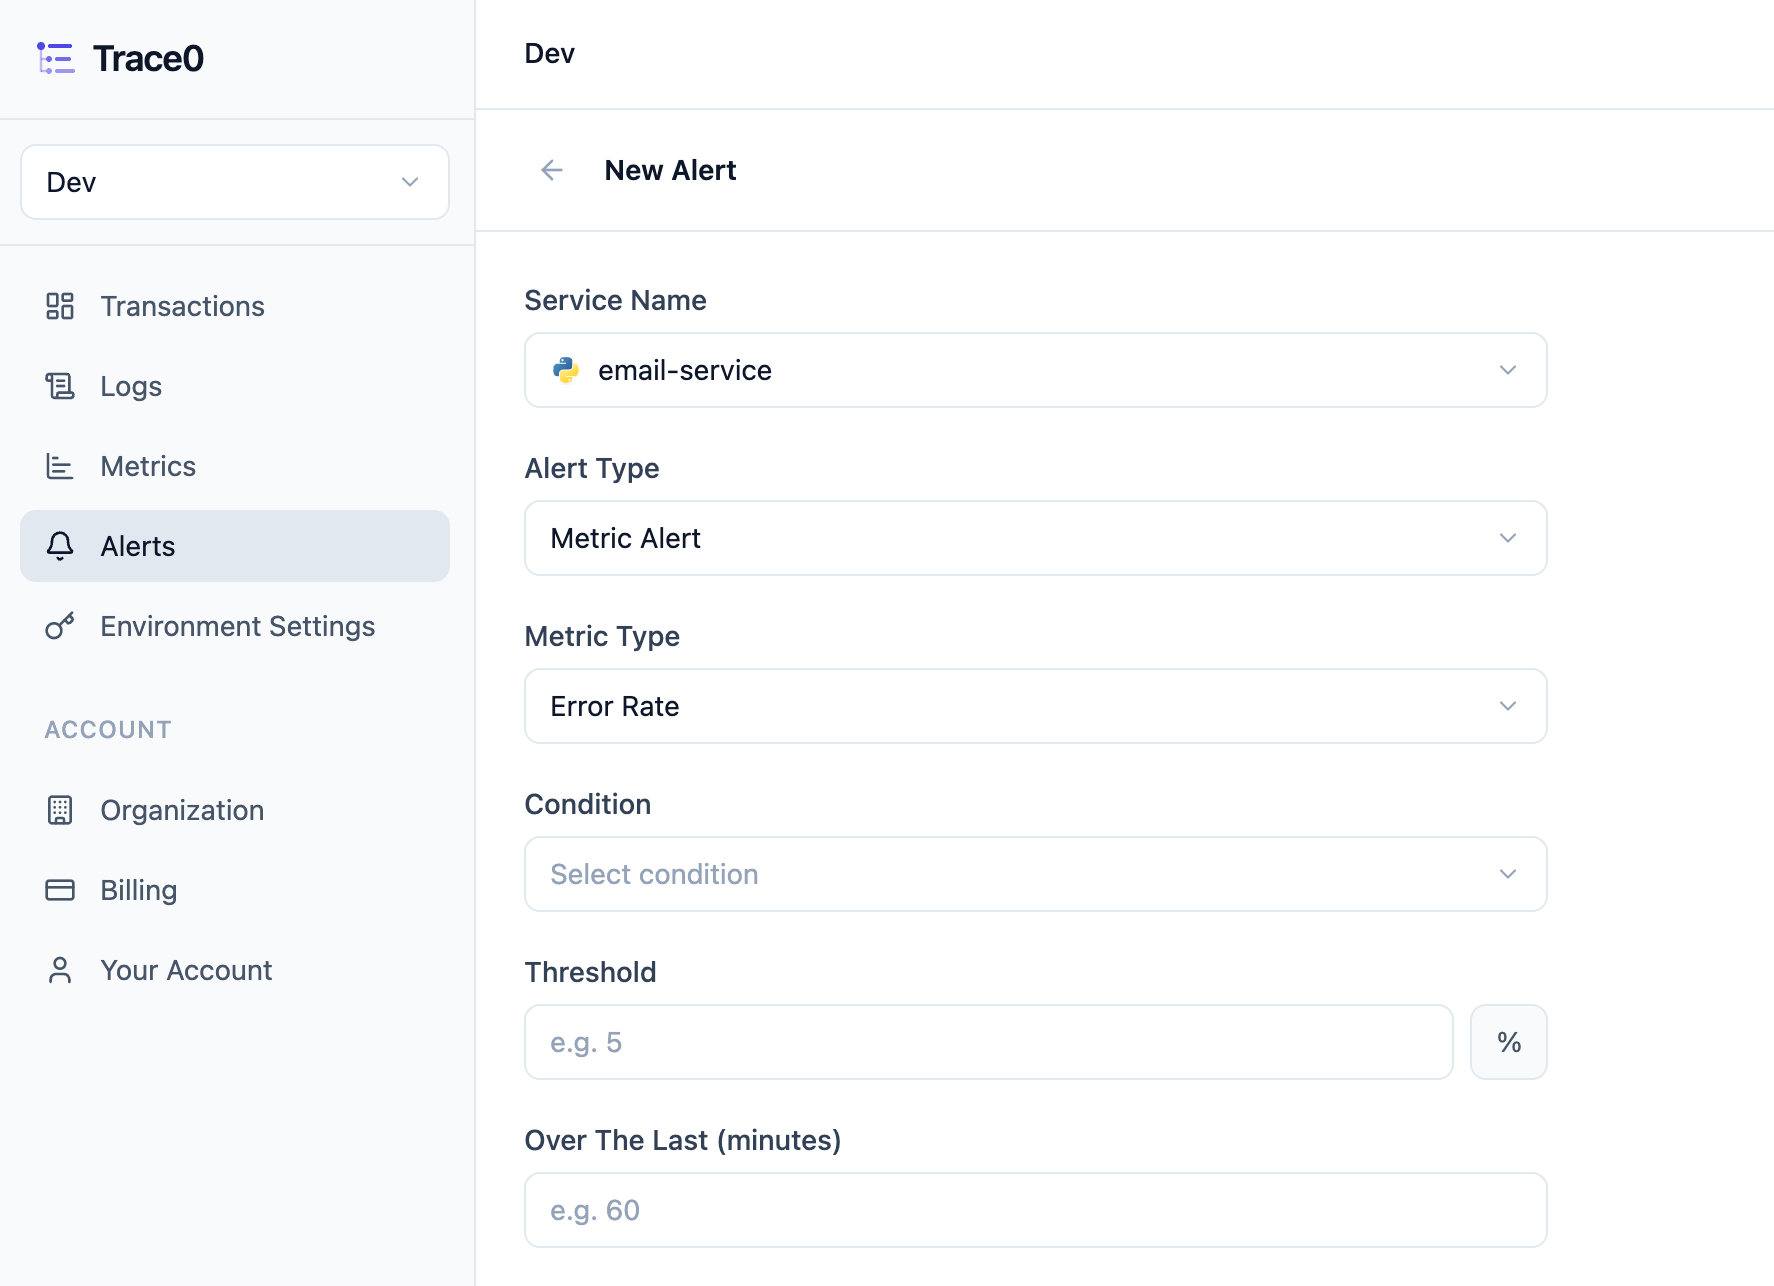
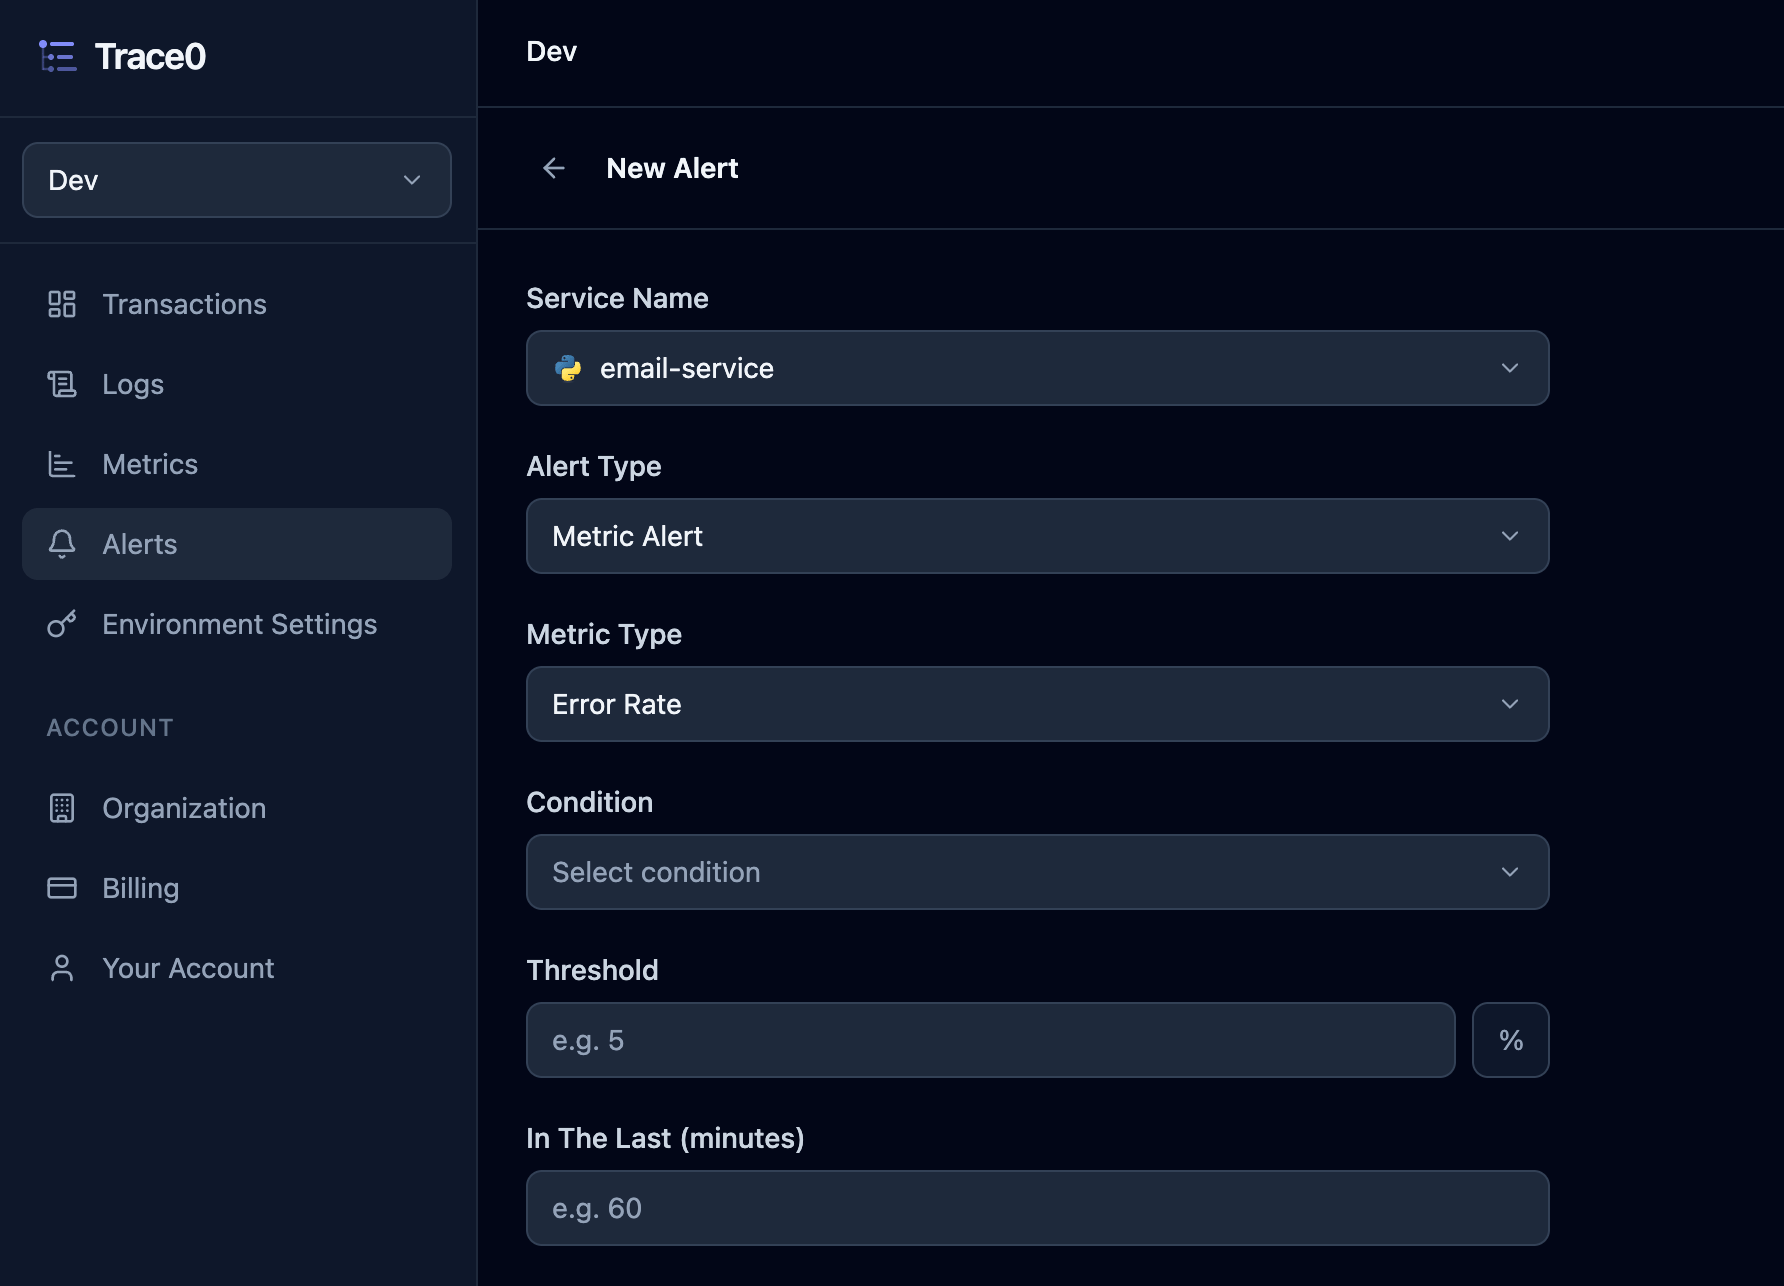
Error Rate is calculated based on the proportion of failing transactions during the specified period. Error logs that are not associated with a trace (i.e. logs without a trace ID) do not contribute to the Error Rate metric.
Destination — Slack, Email, or both.
- If you select
Email, enter the email address you want to receive alert notifications. - If you select
Slack, enter the Webhook URL for the channel you want to receive alert notifications.
Triggered Alerts
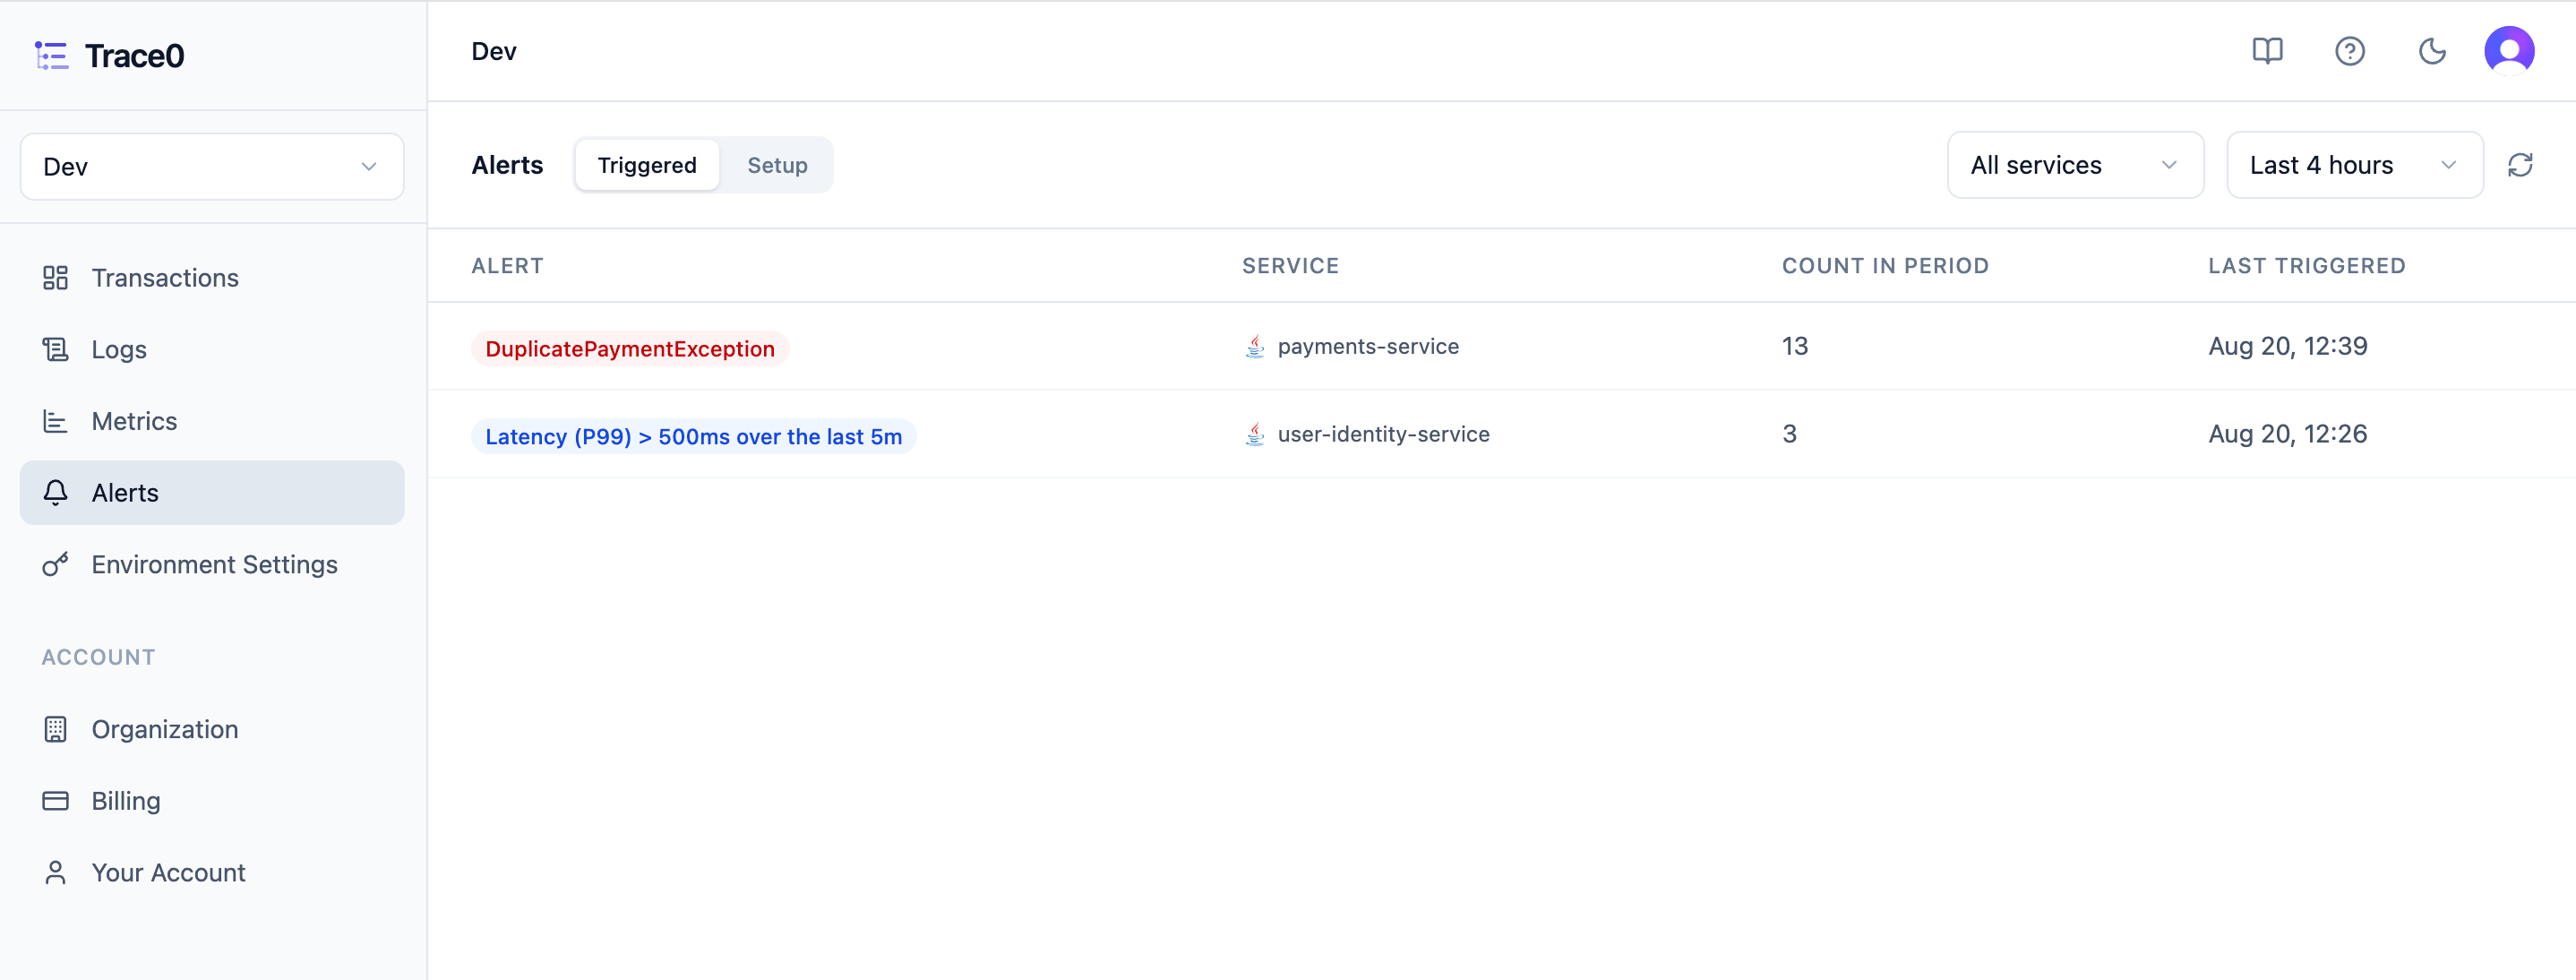
Once an alert is triggered, you will be notified in the Destinations that you configured for the alert, and it will also appear in theTriggered section:
Error Alert Detail
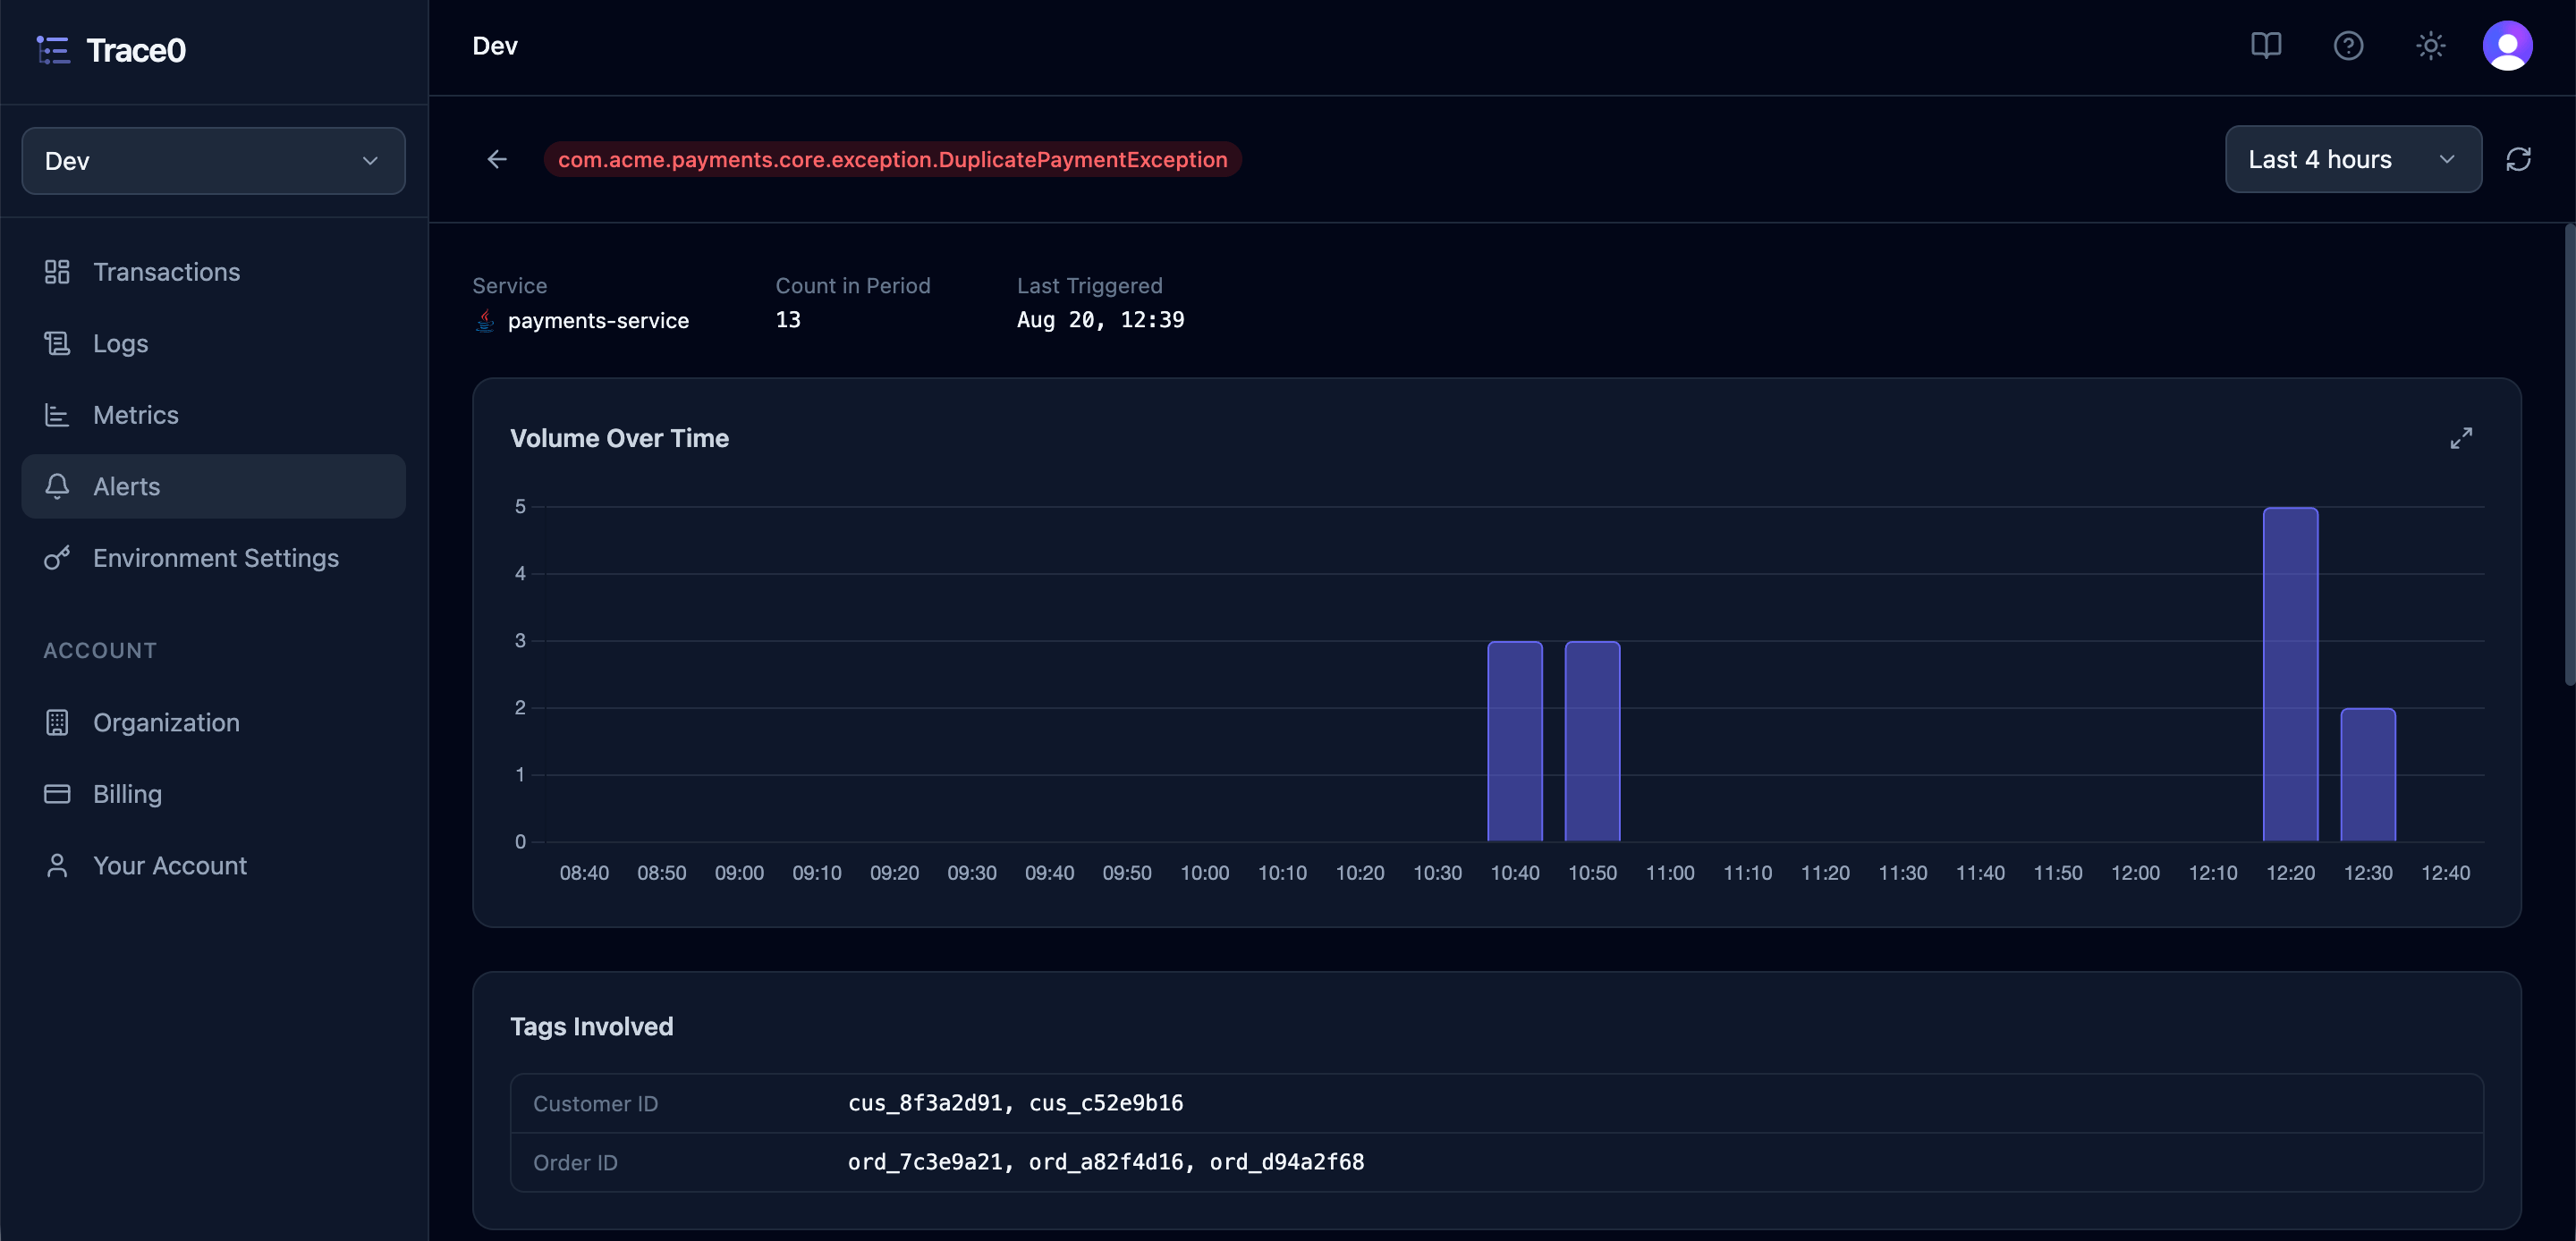
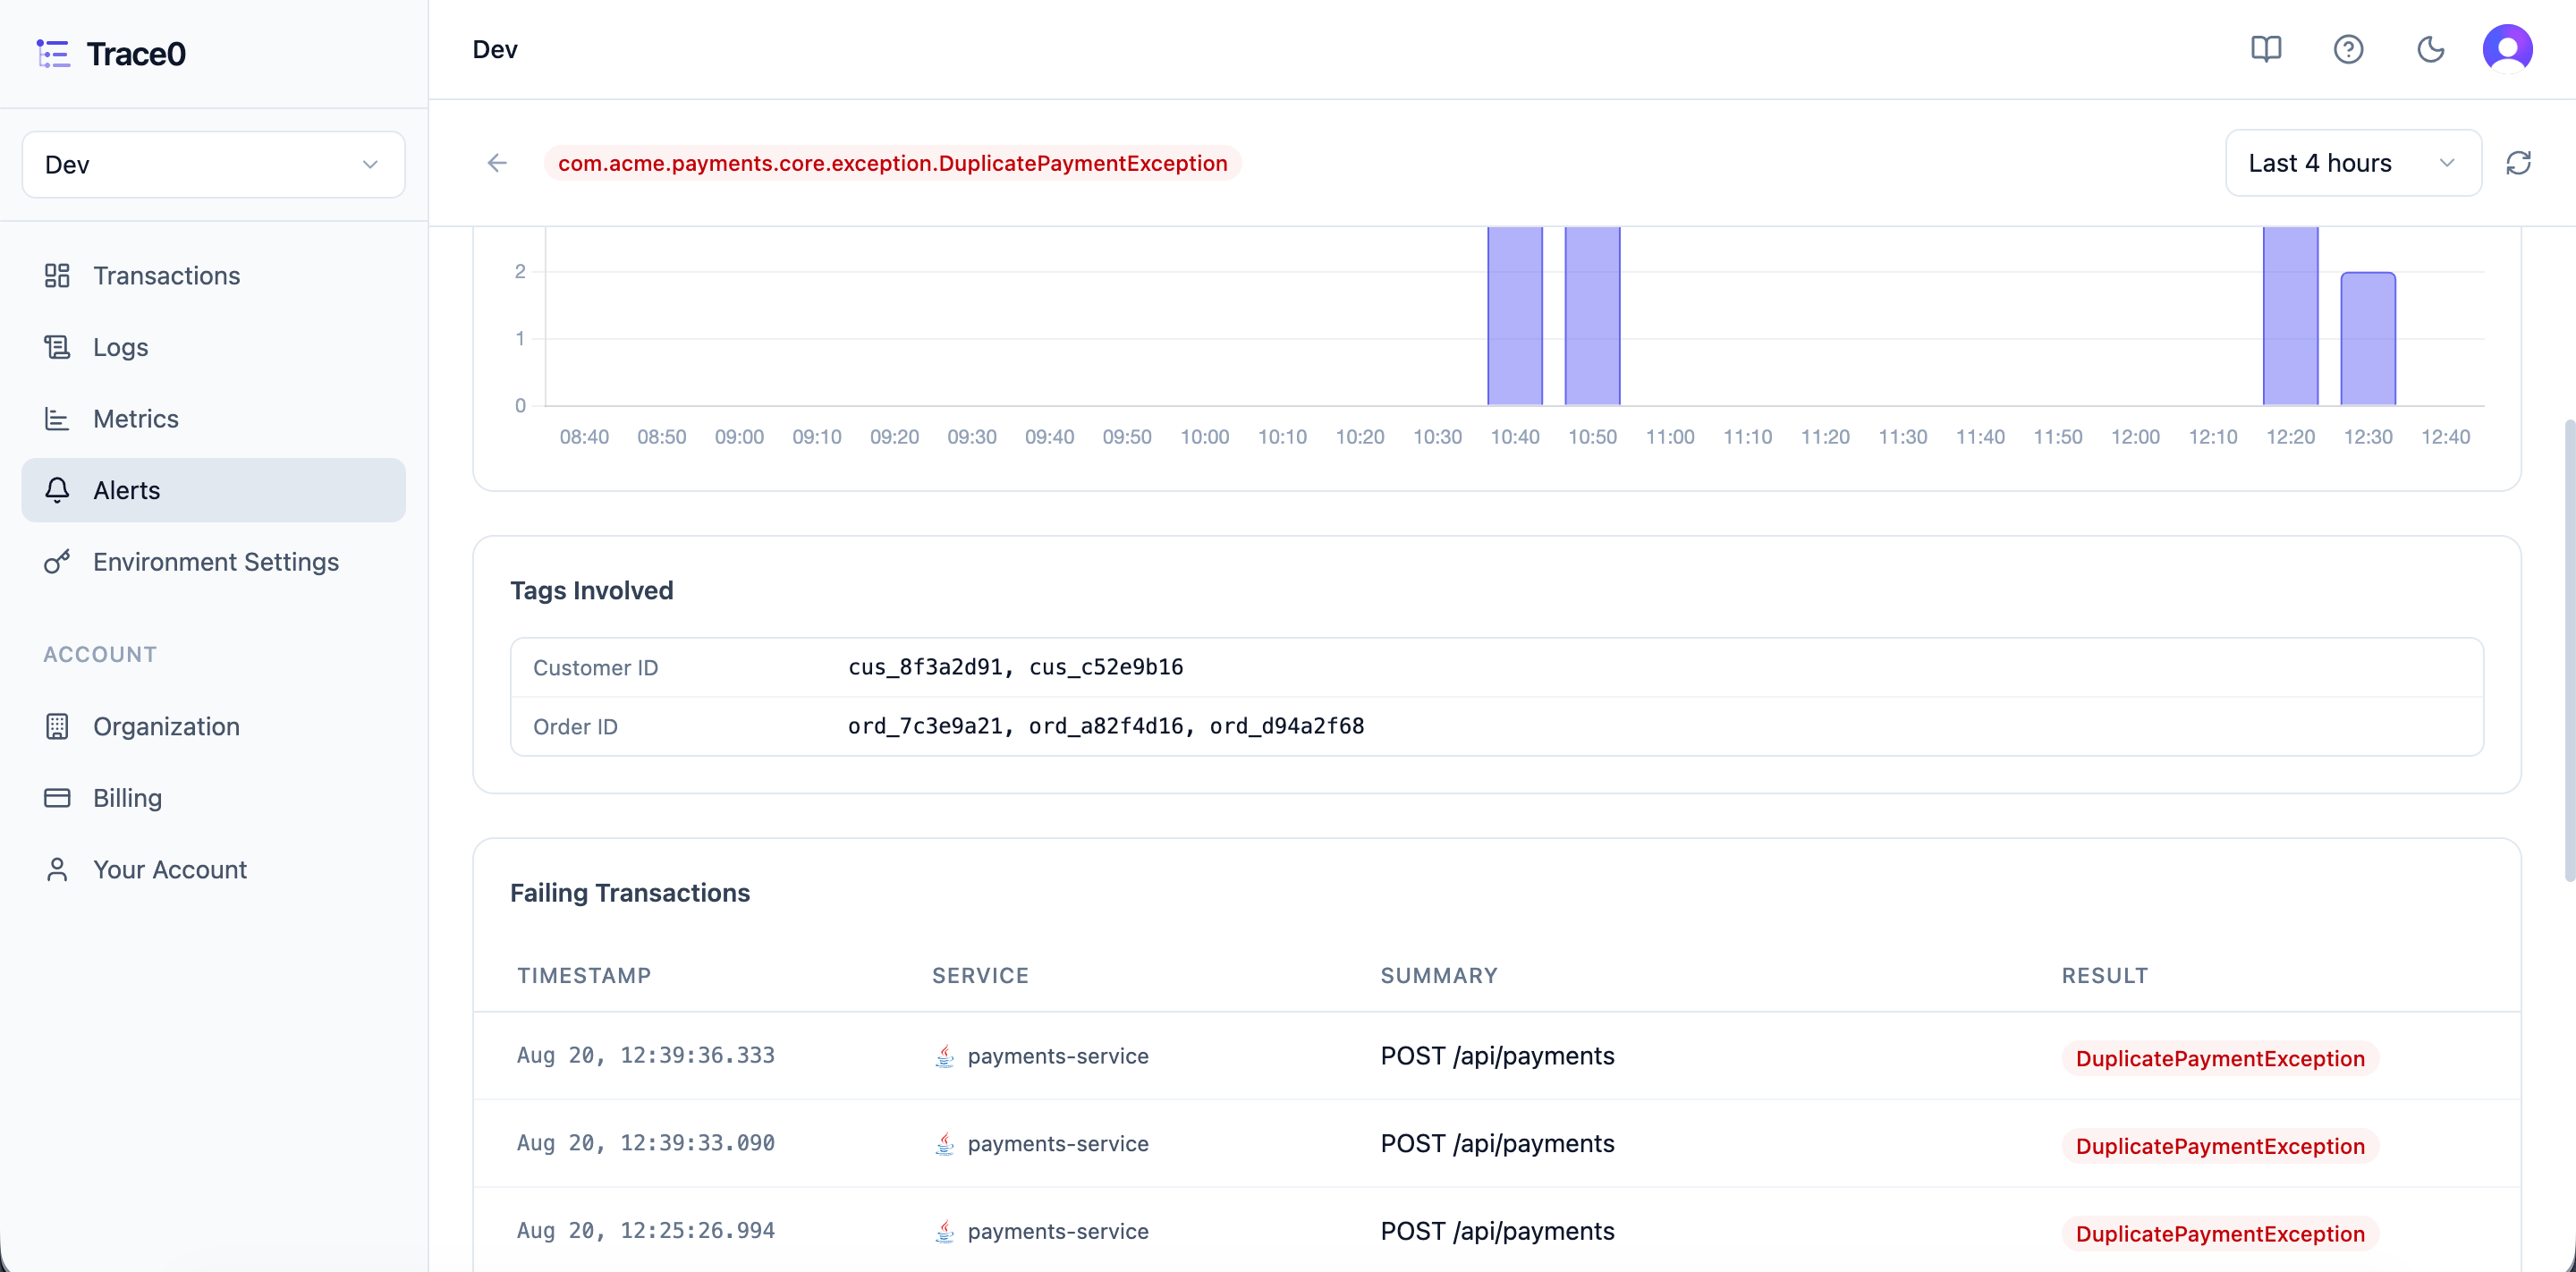
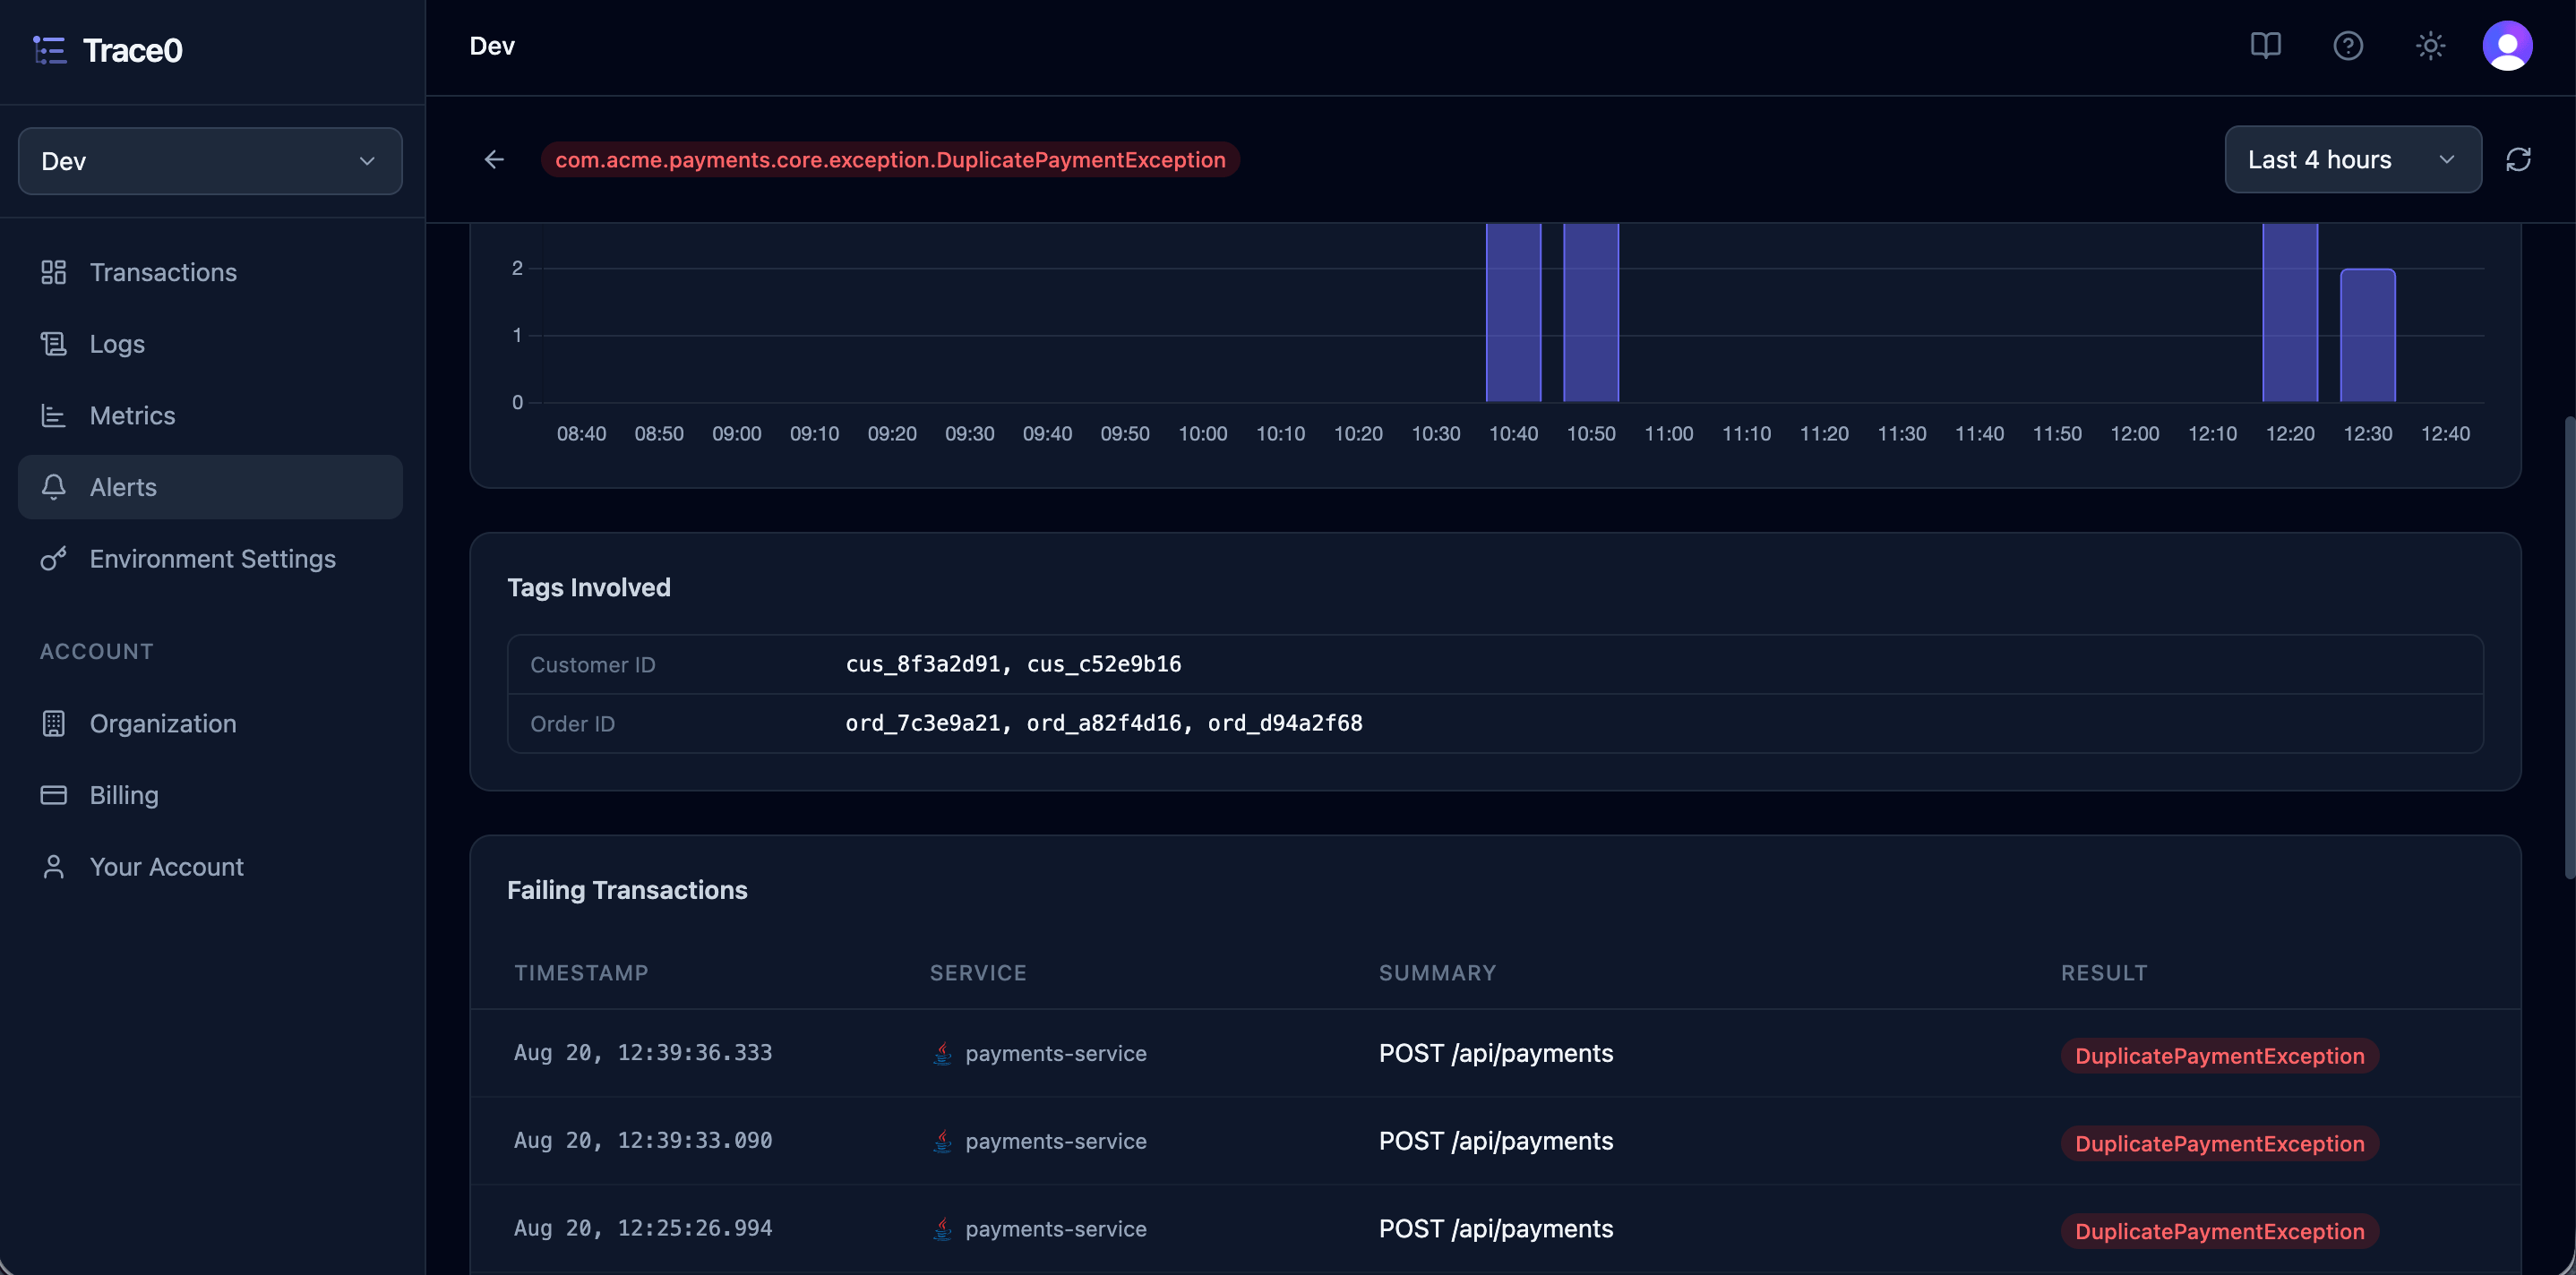
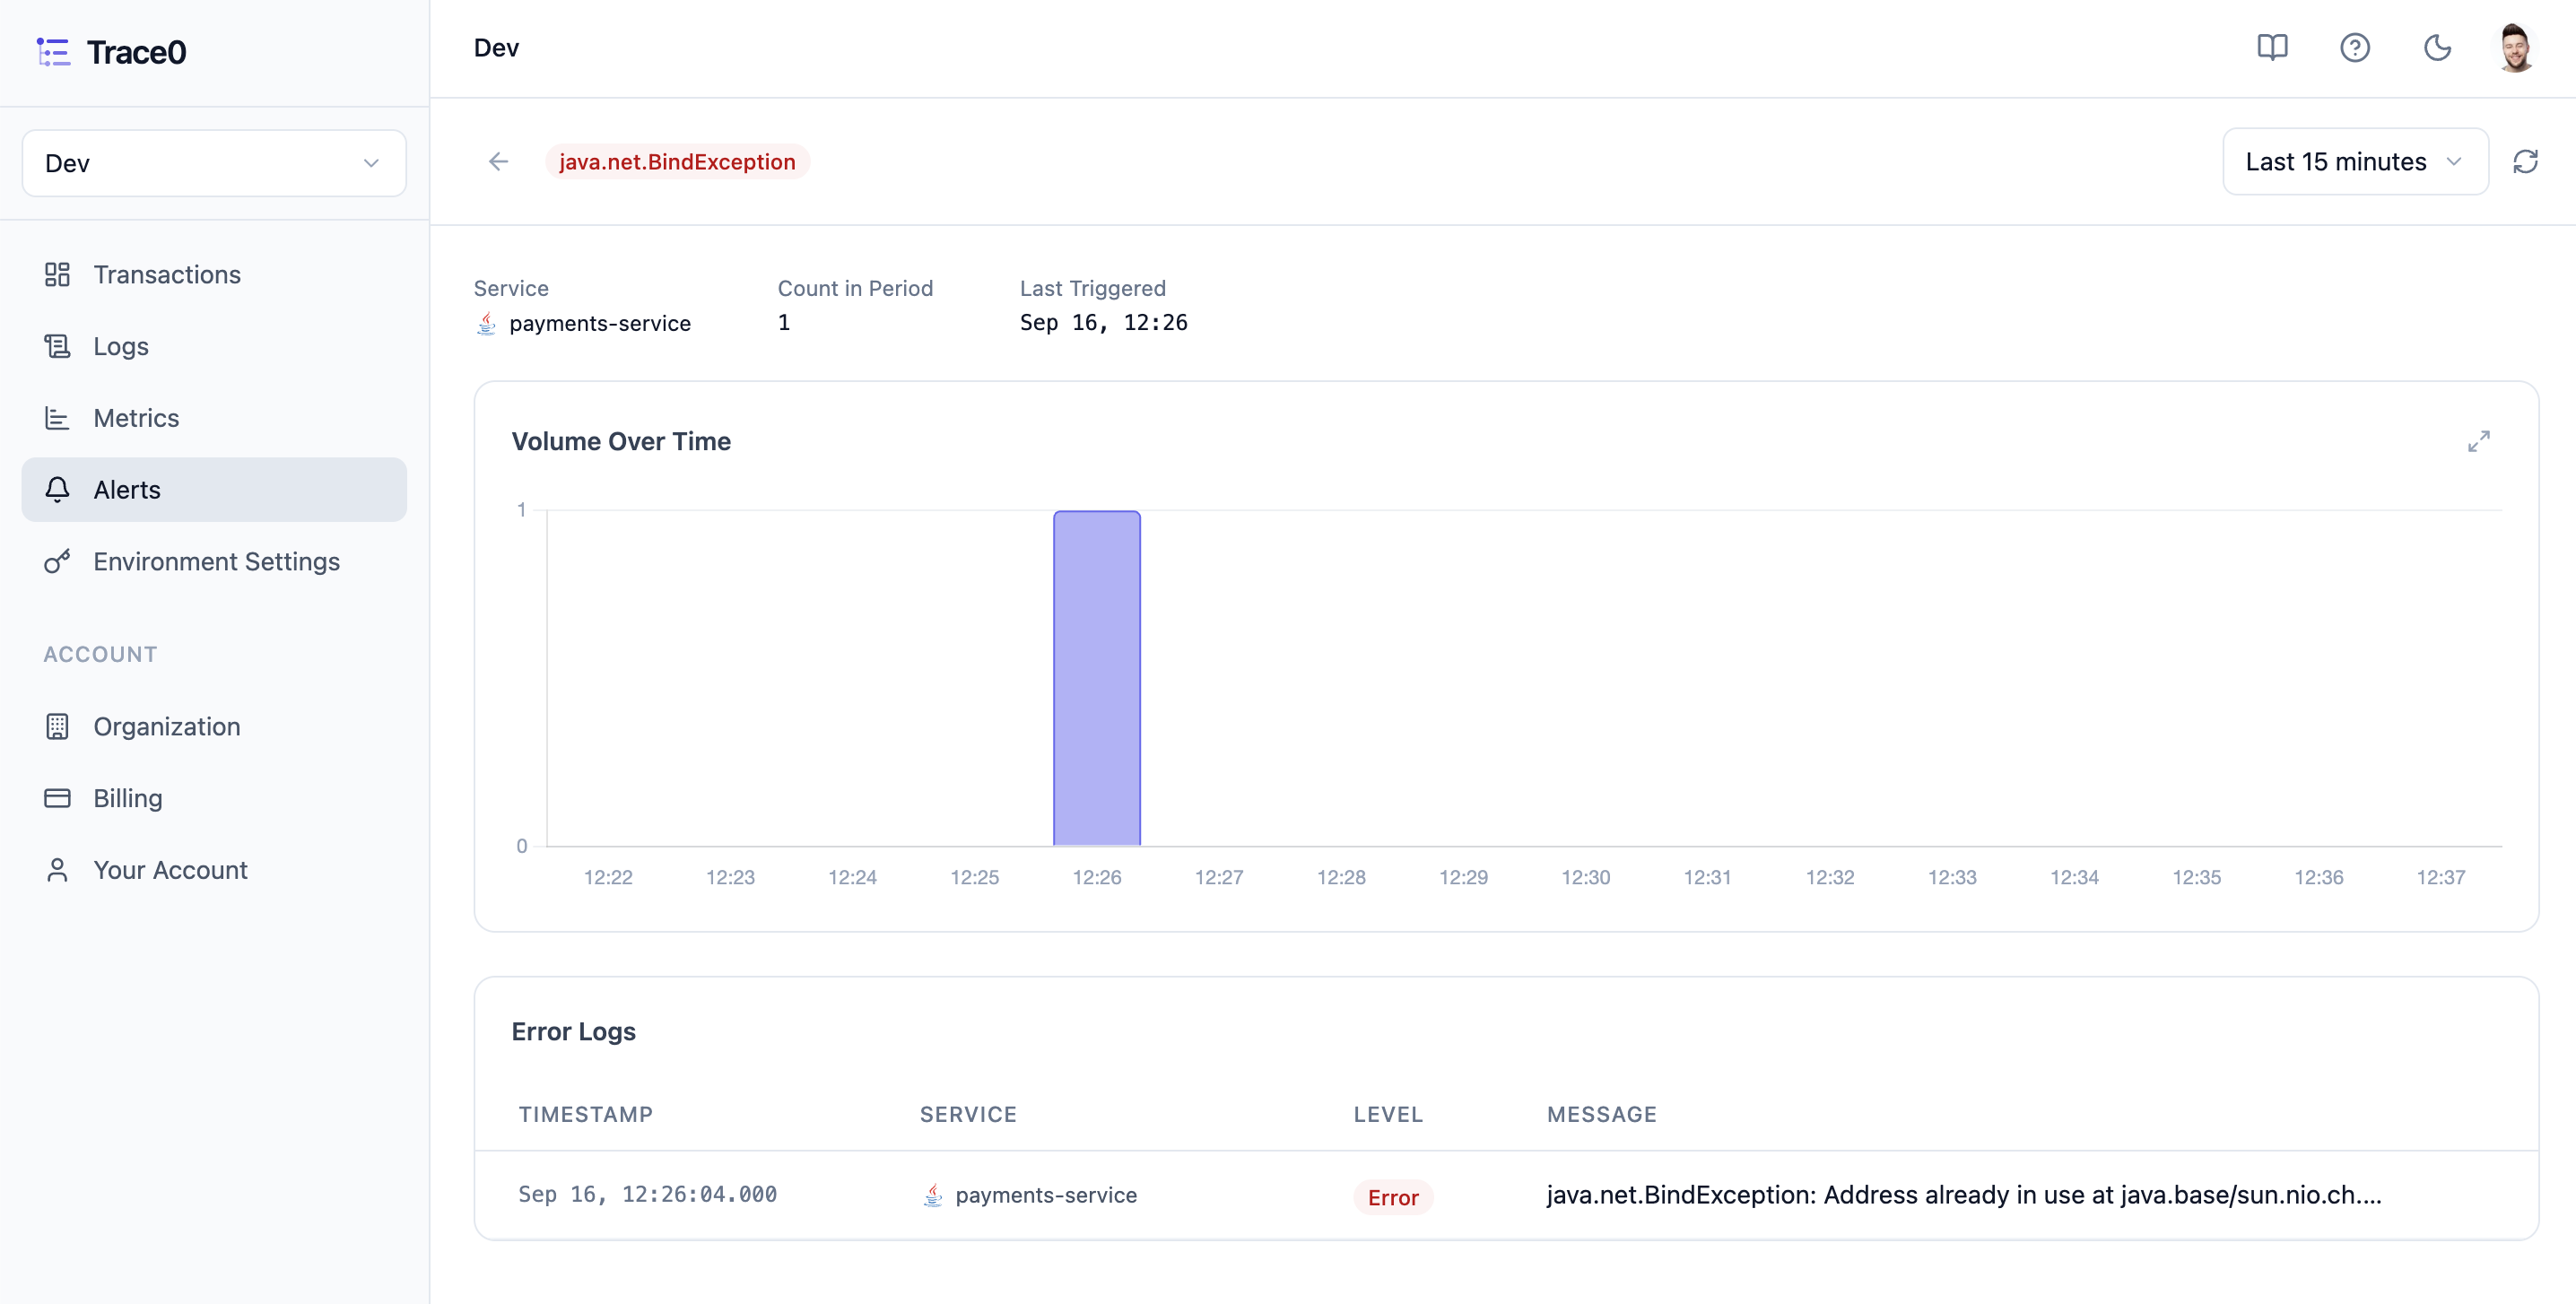
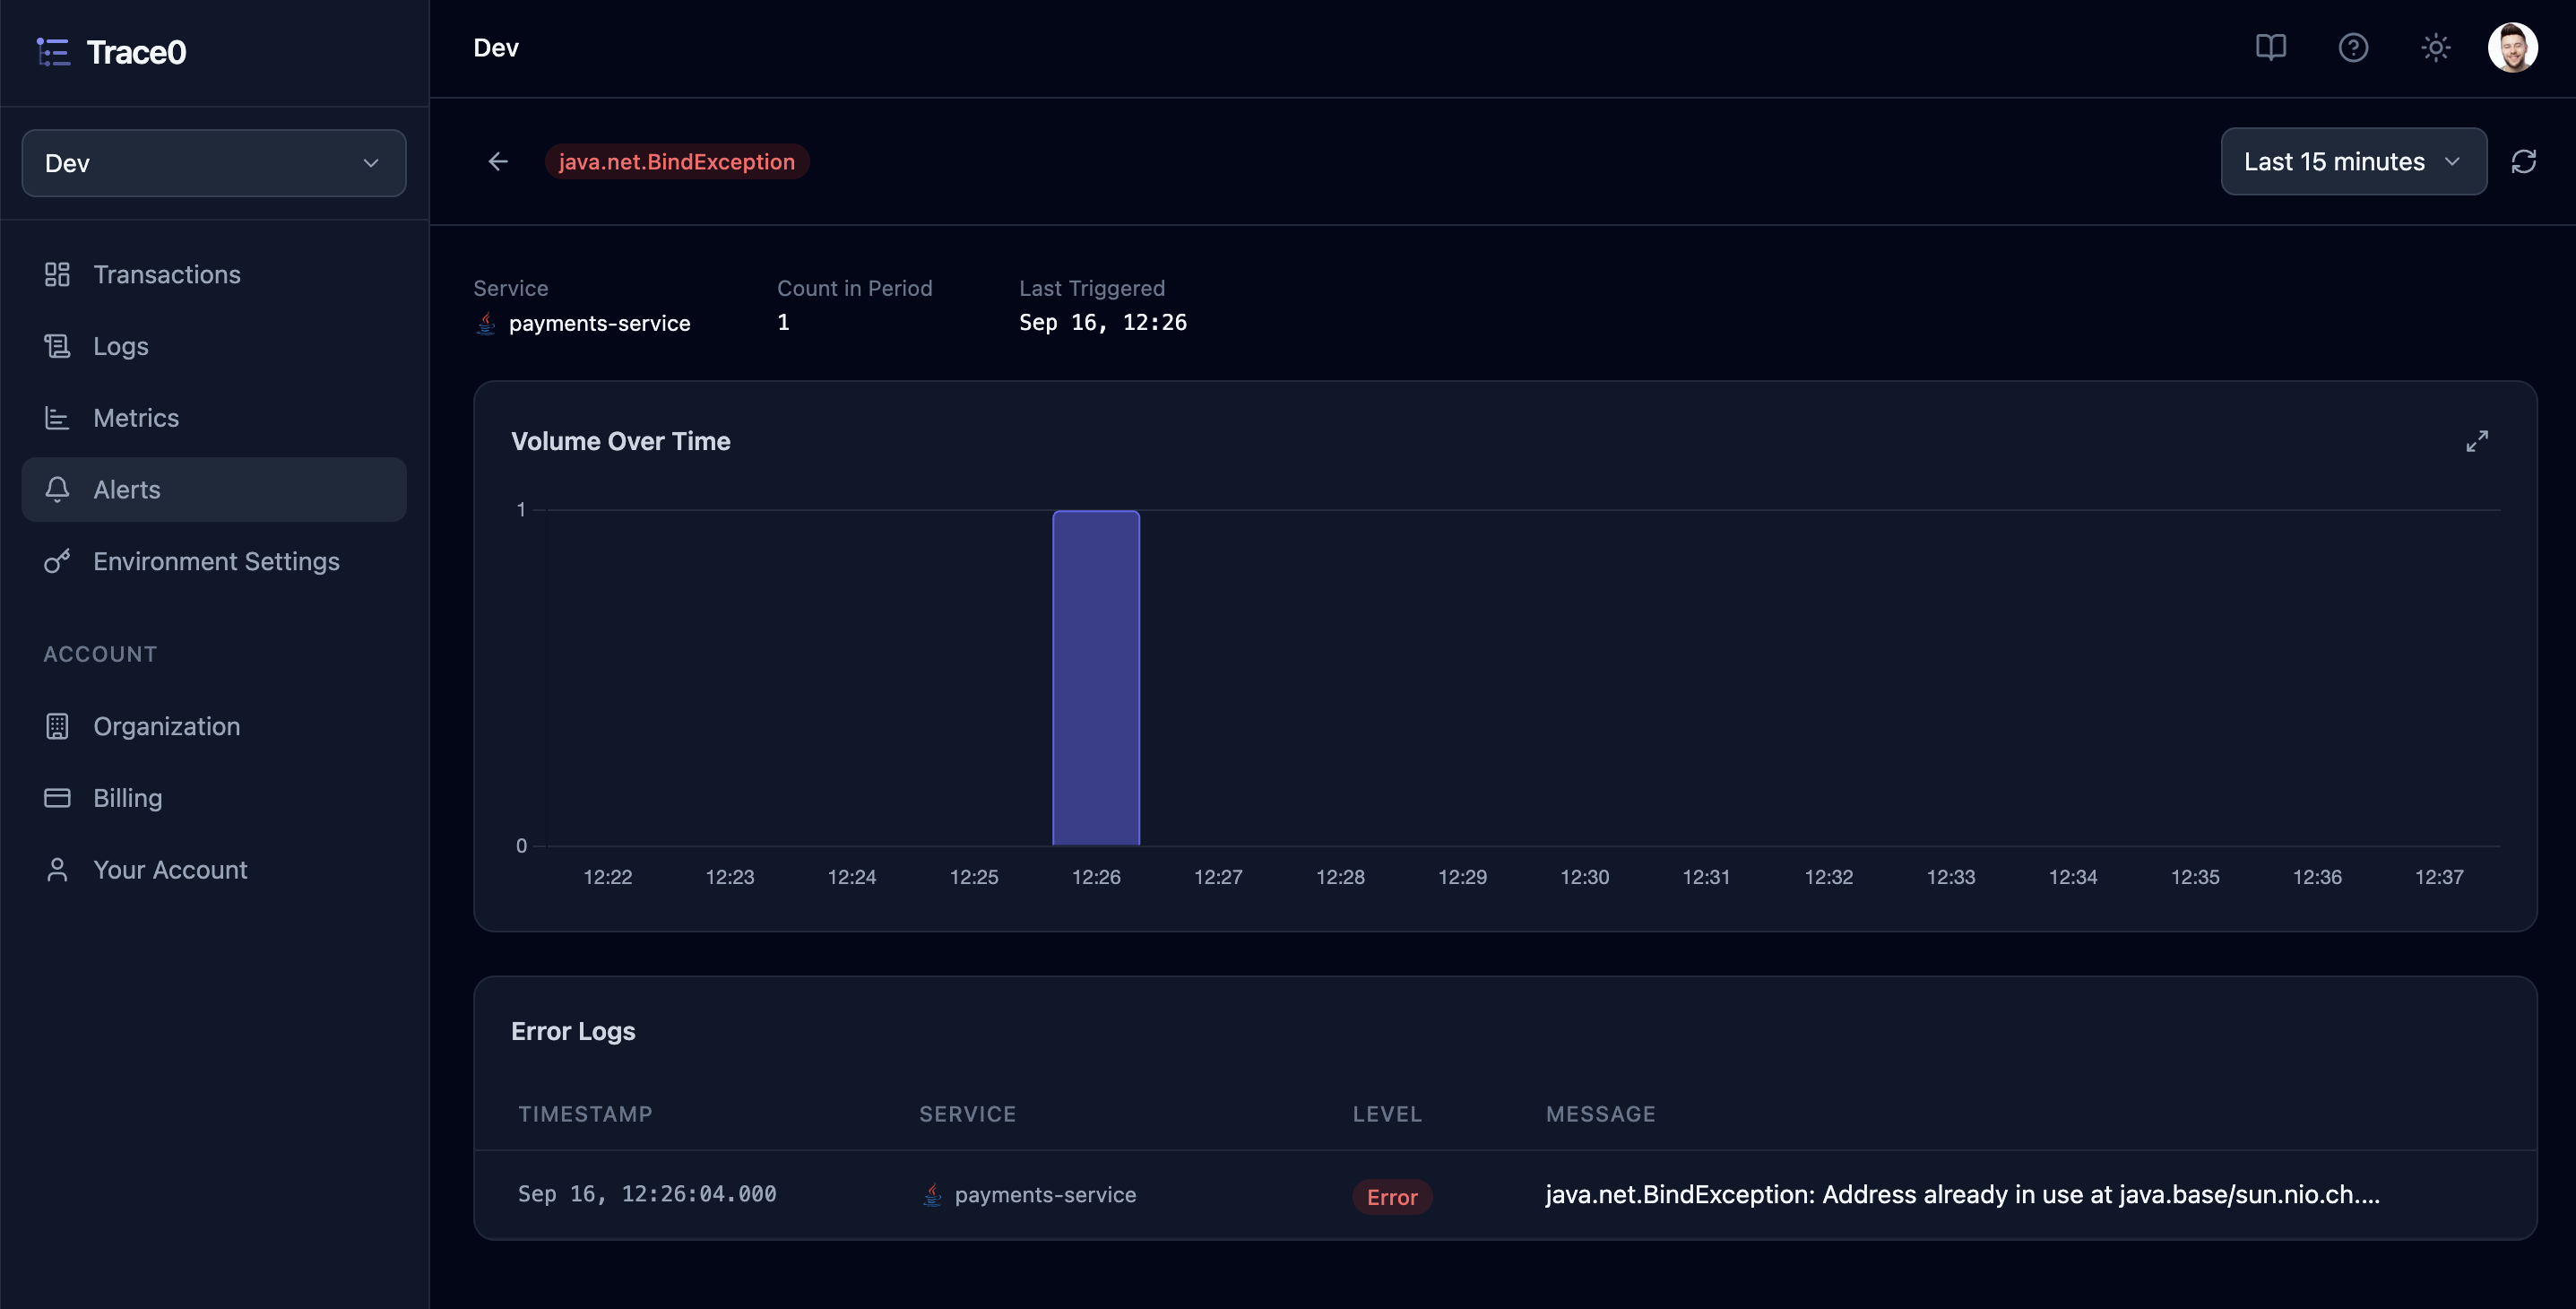
For triggered error alerts, you can view the alert Volume Over Time, the Tags Involved to understand which users, customers, orders, or other business entities were affected, and the Failing Transactions that triggered the alert.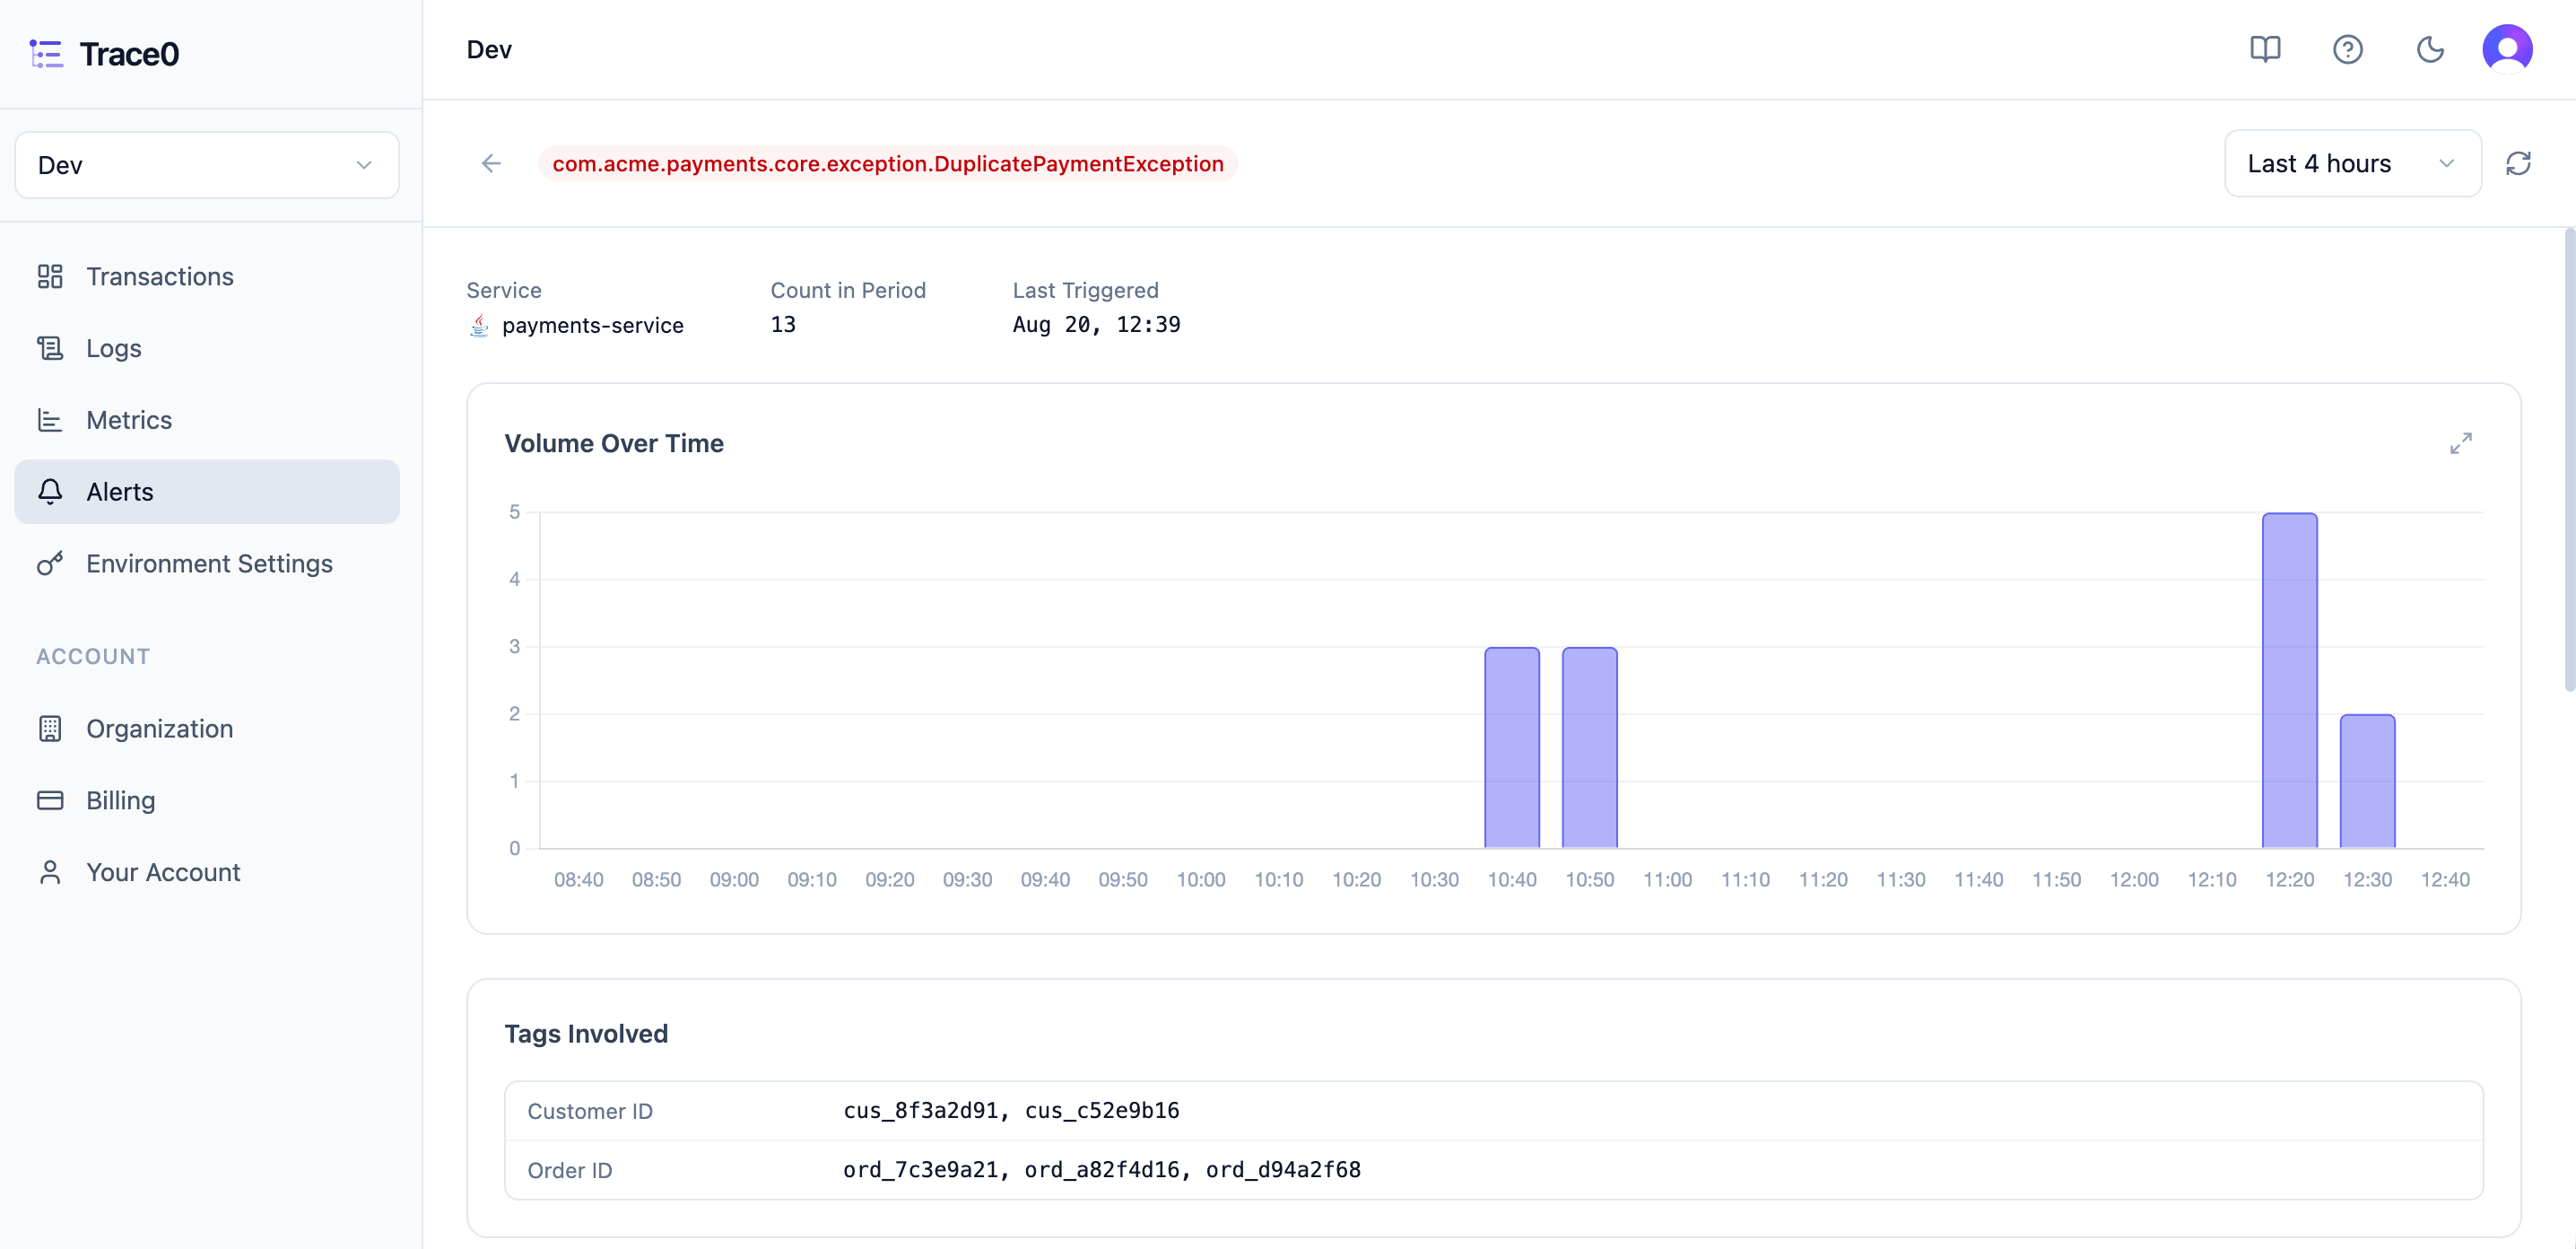
Metric Alert Detail
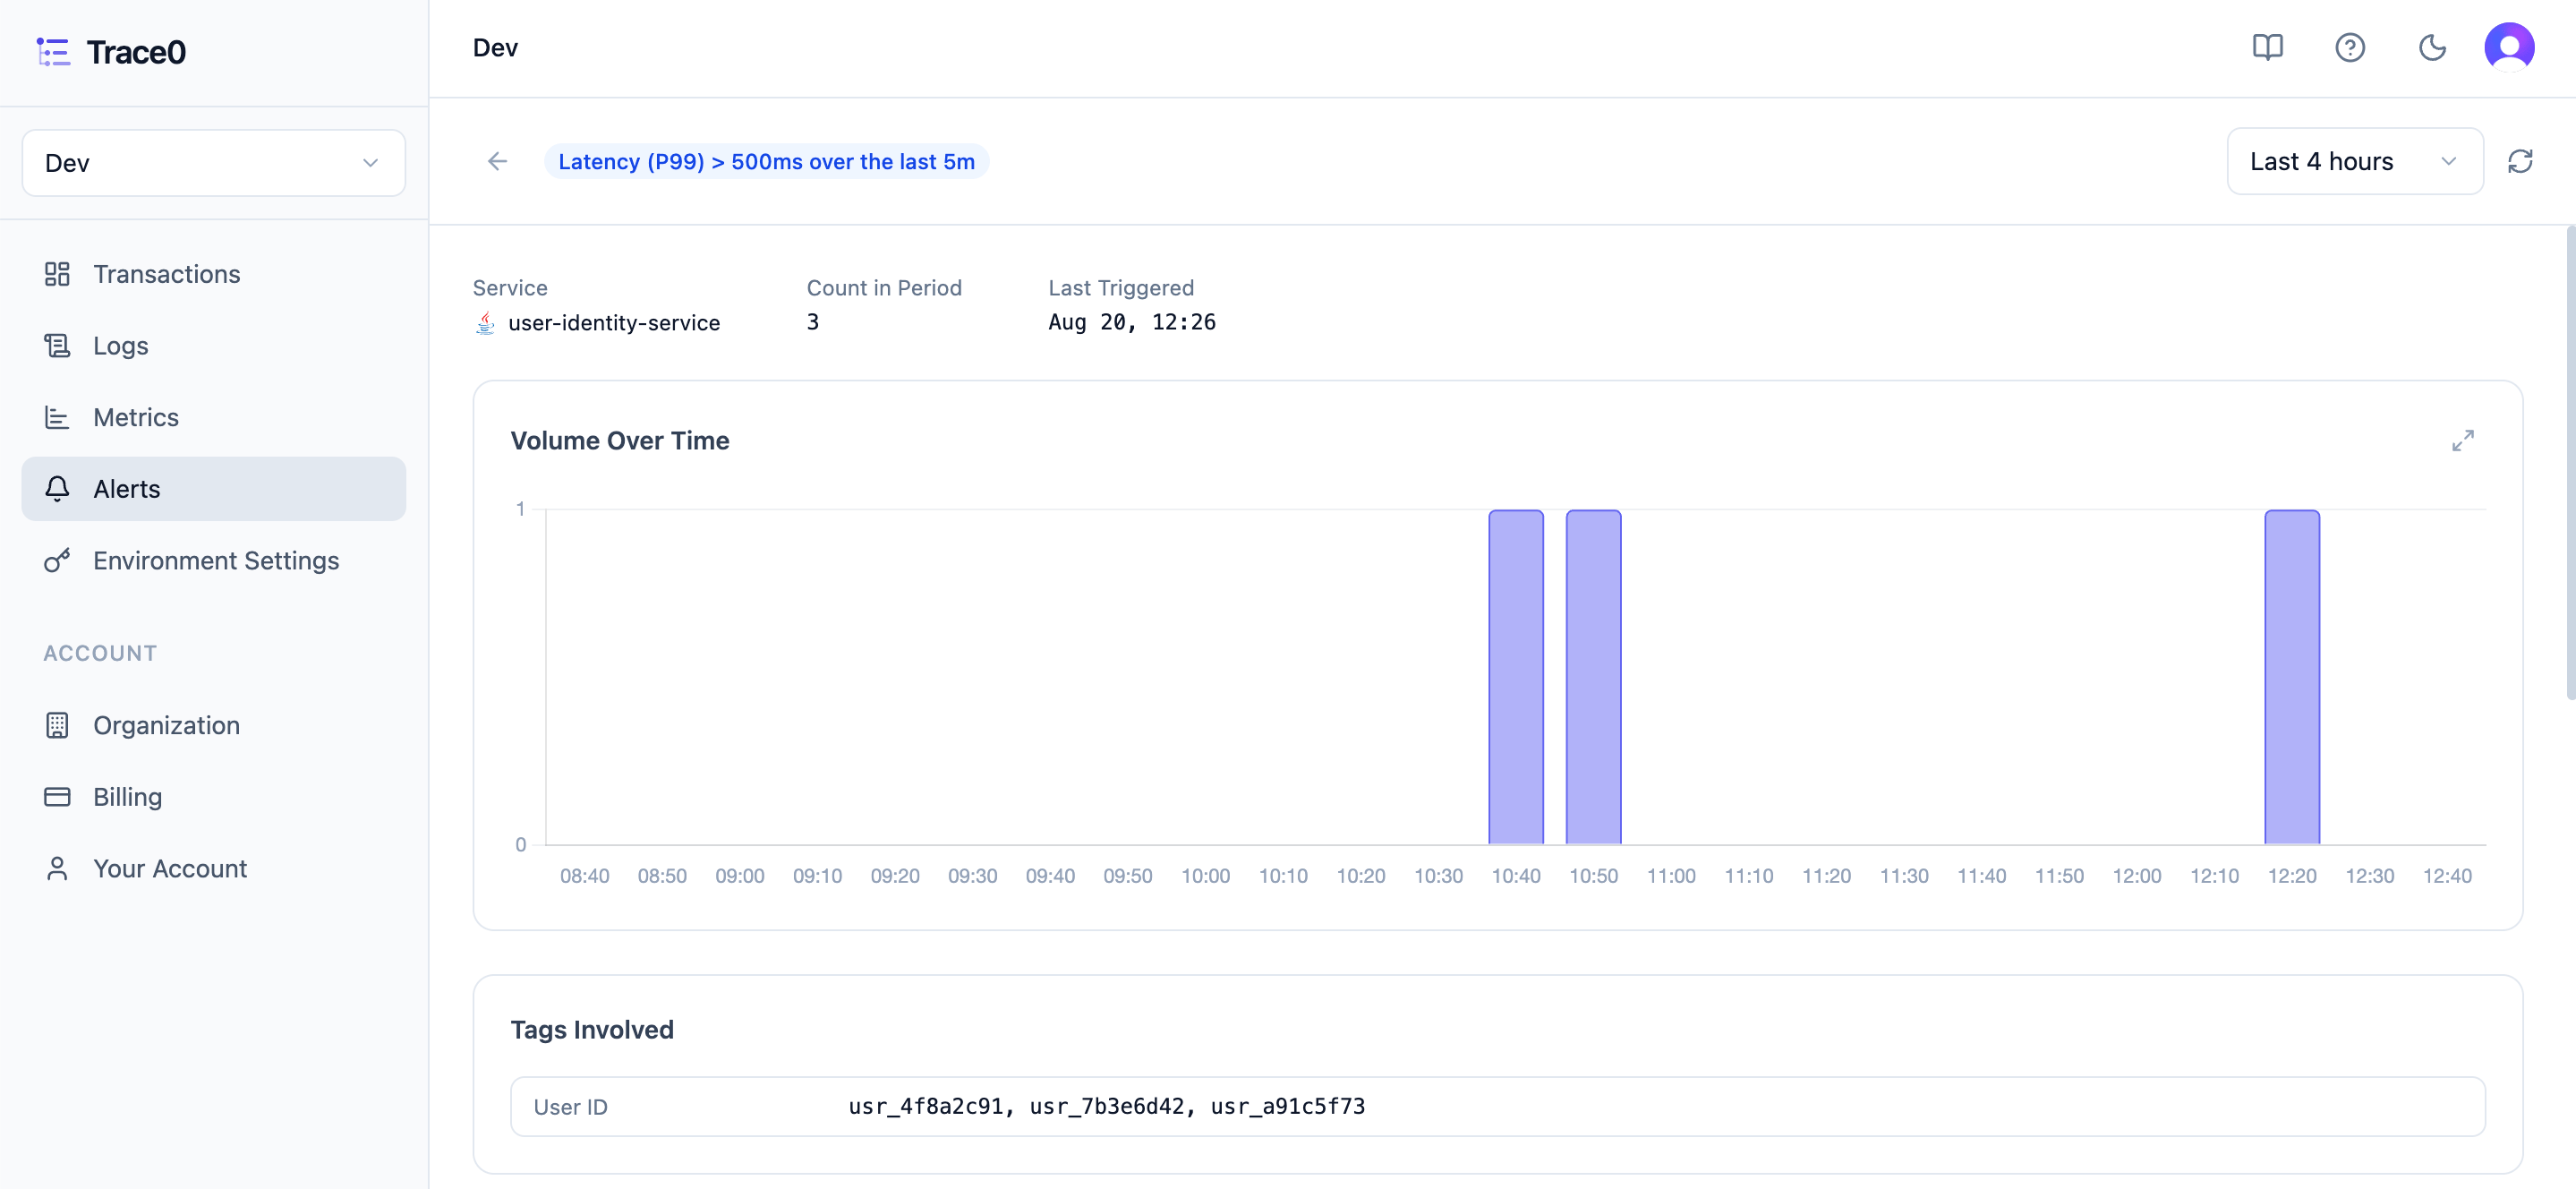
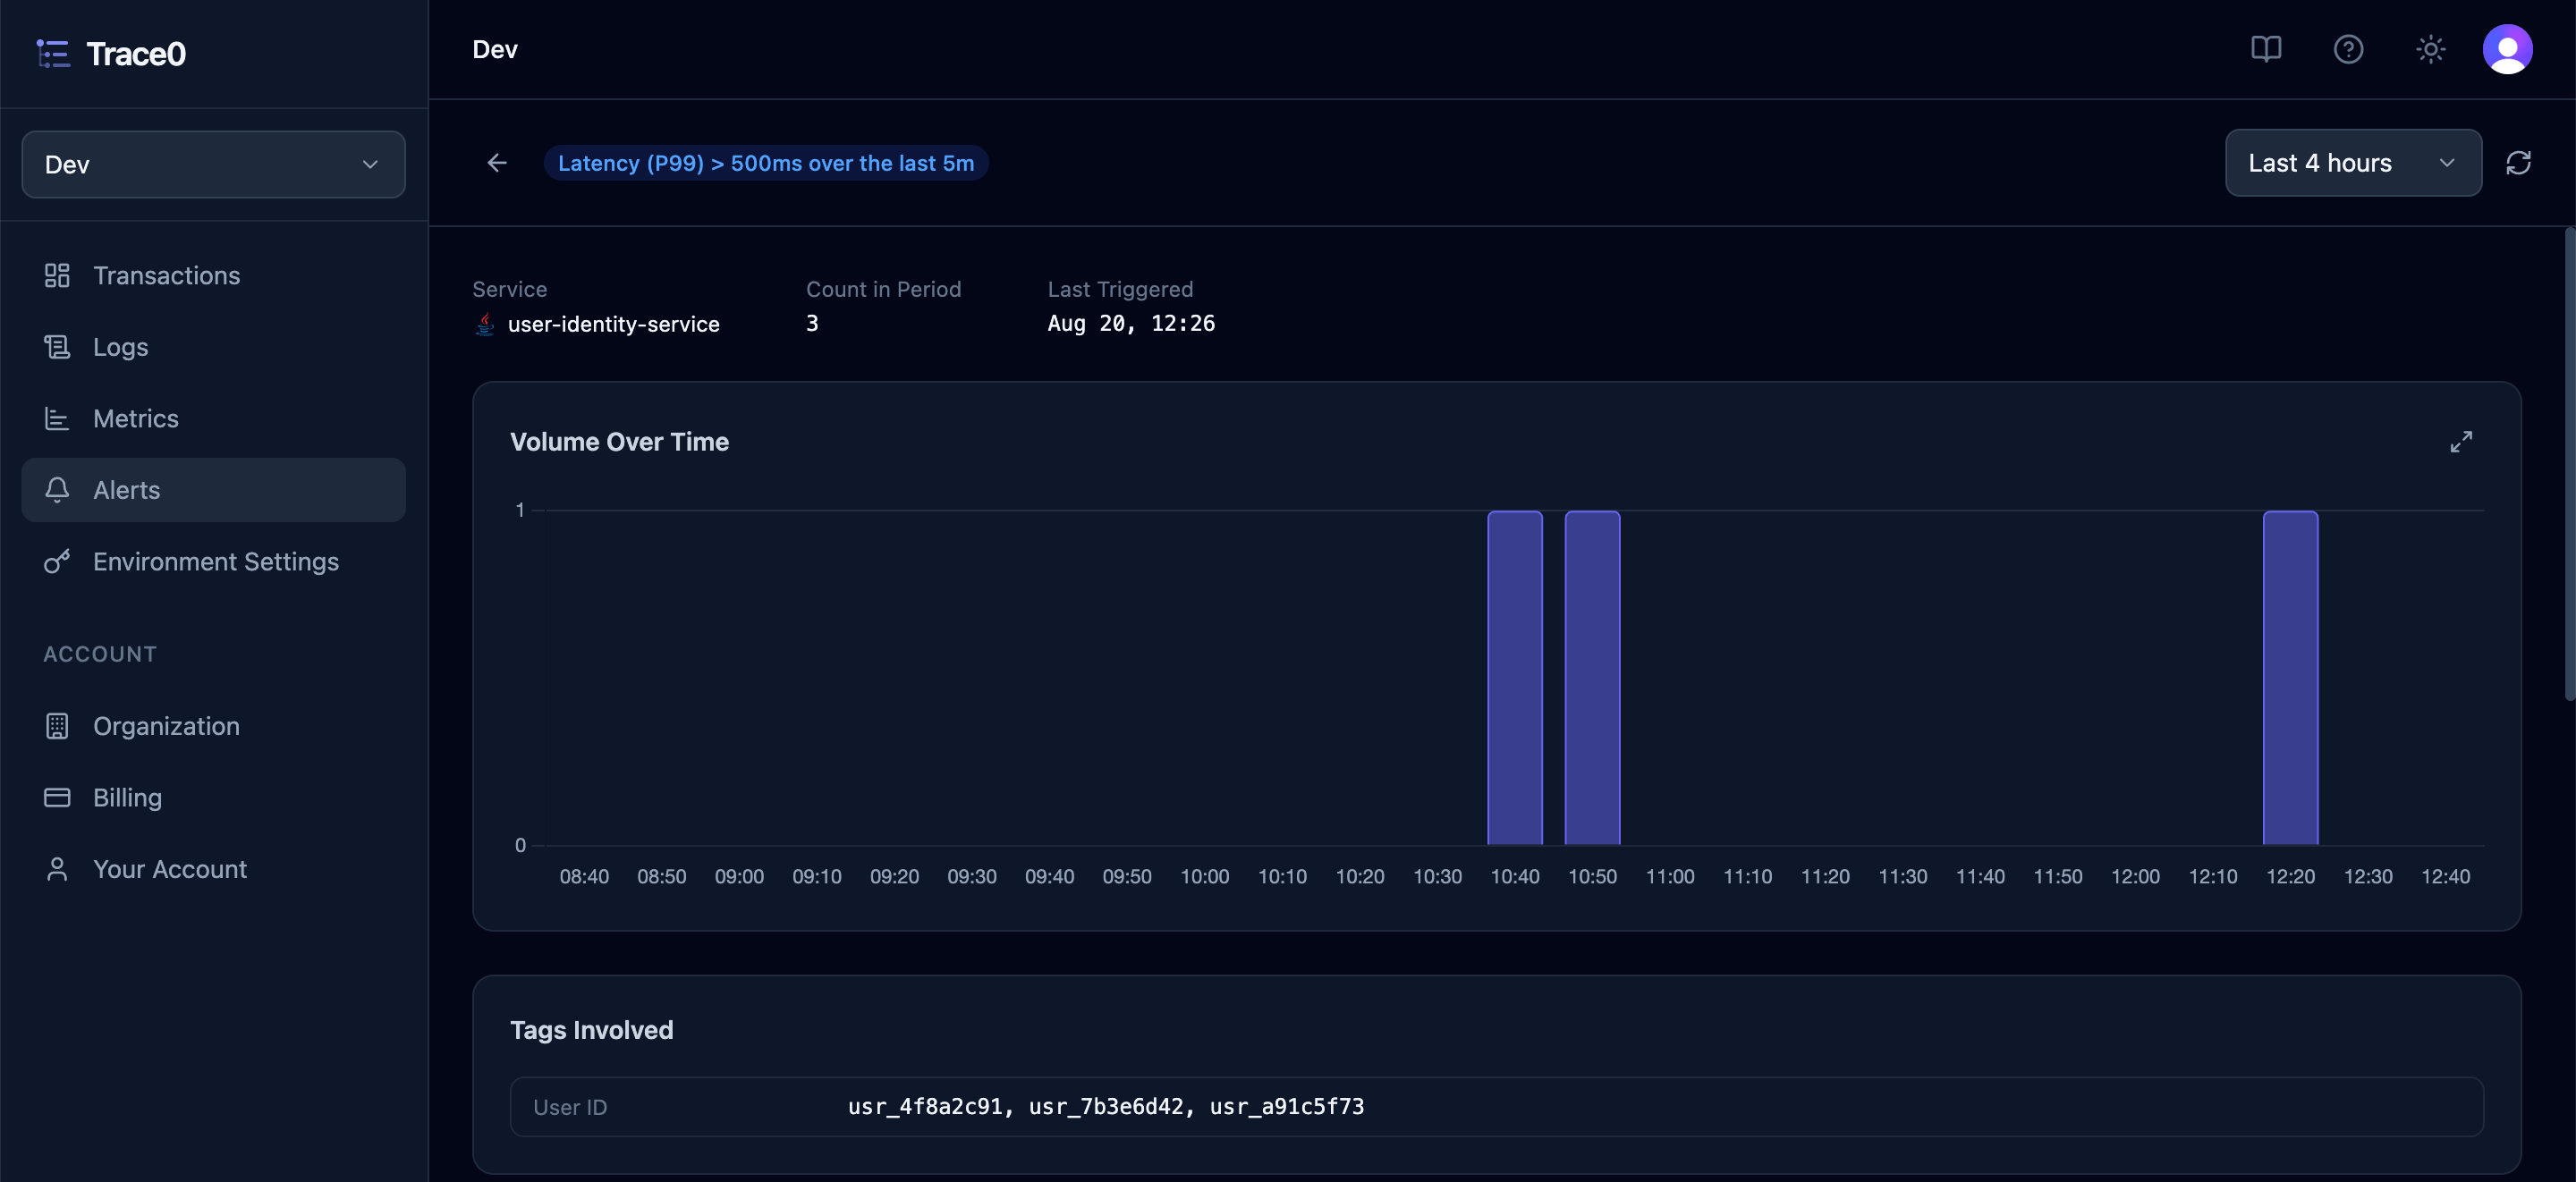
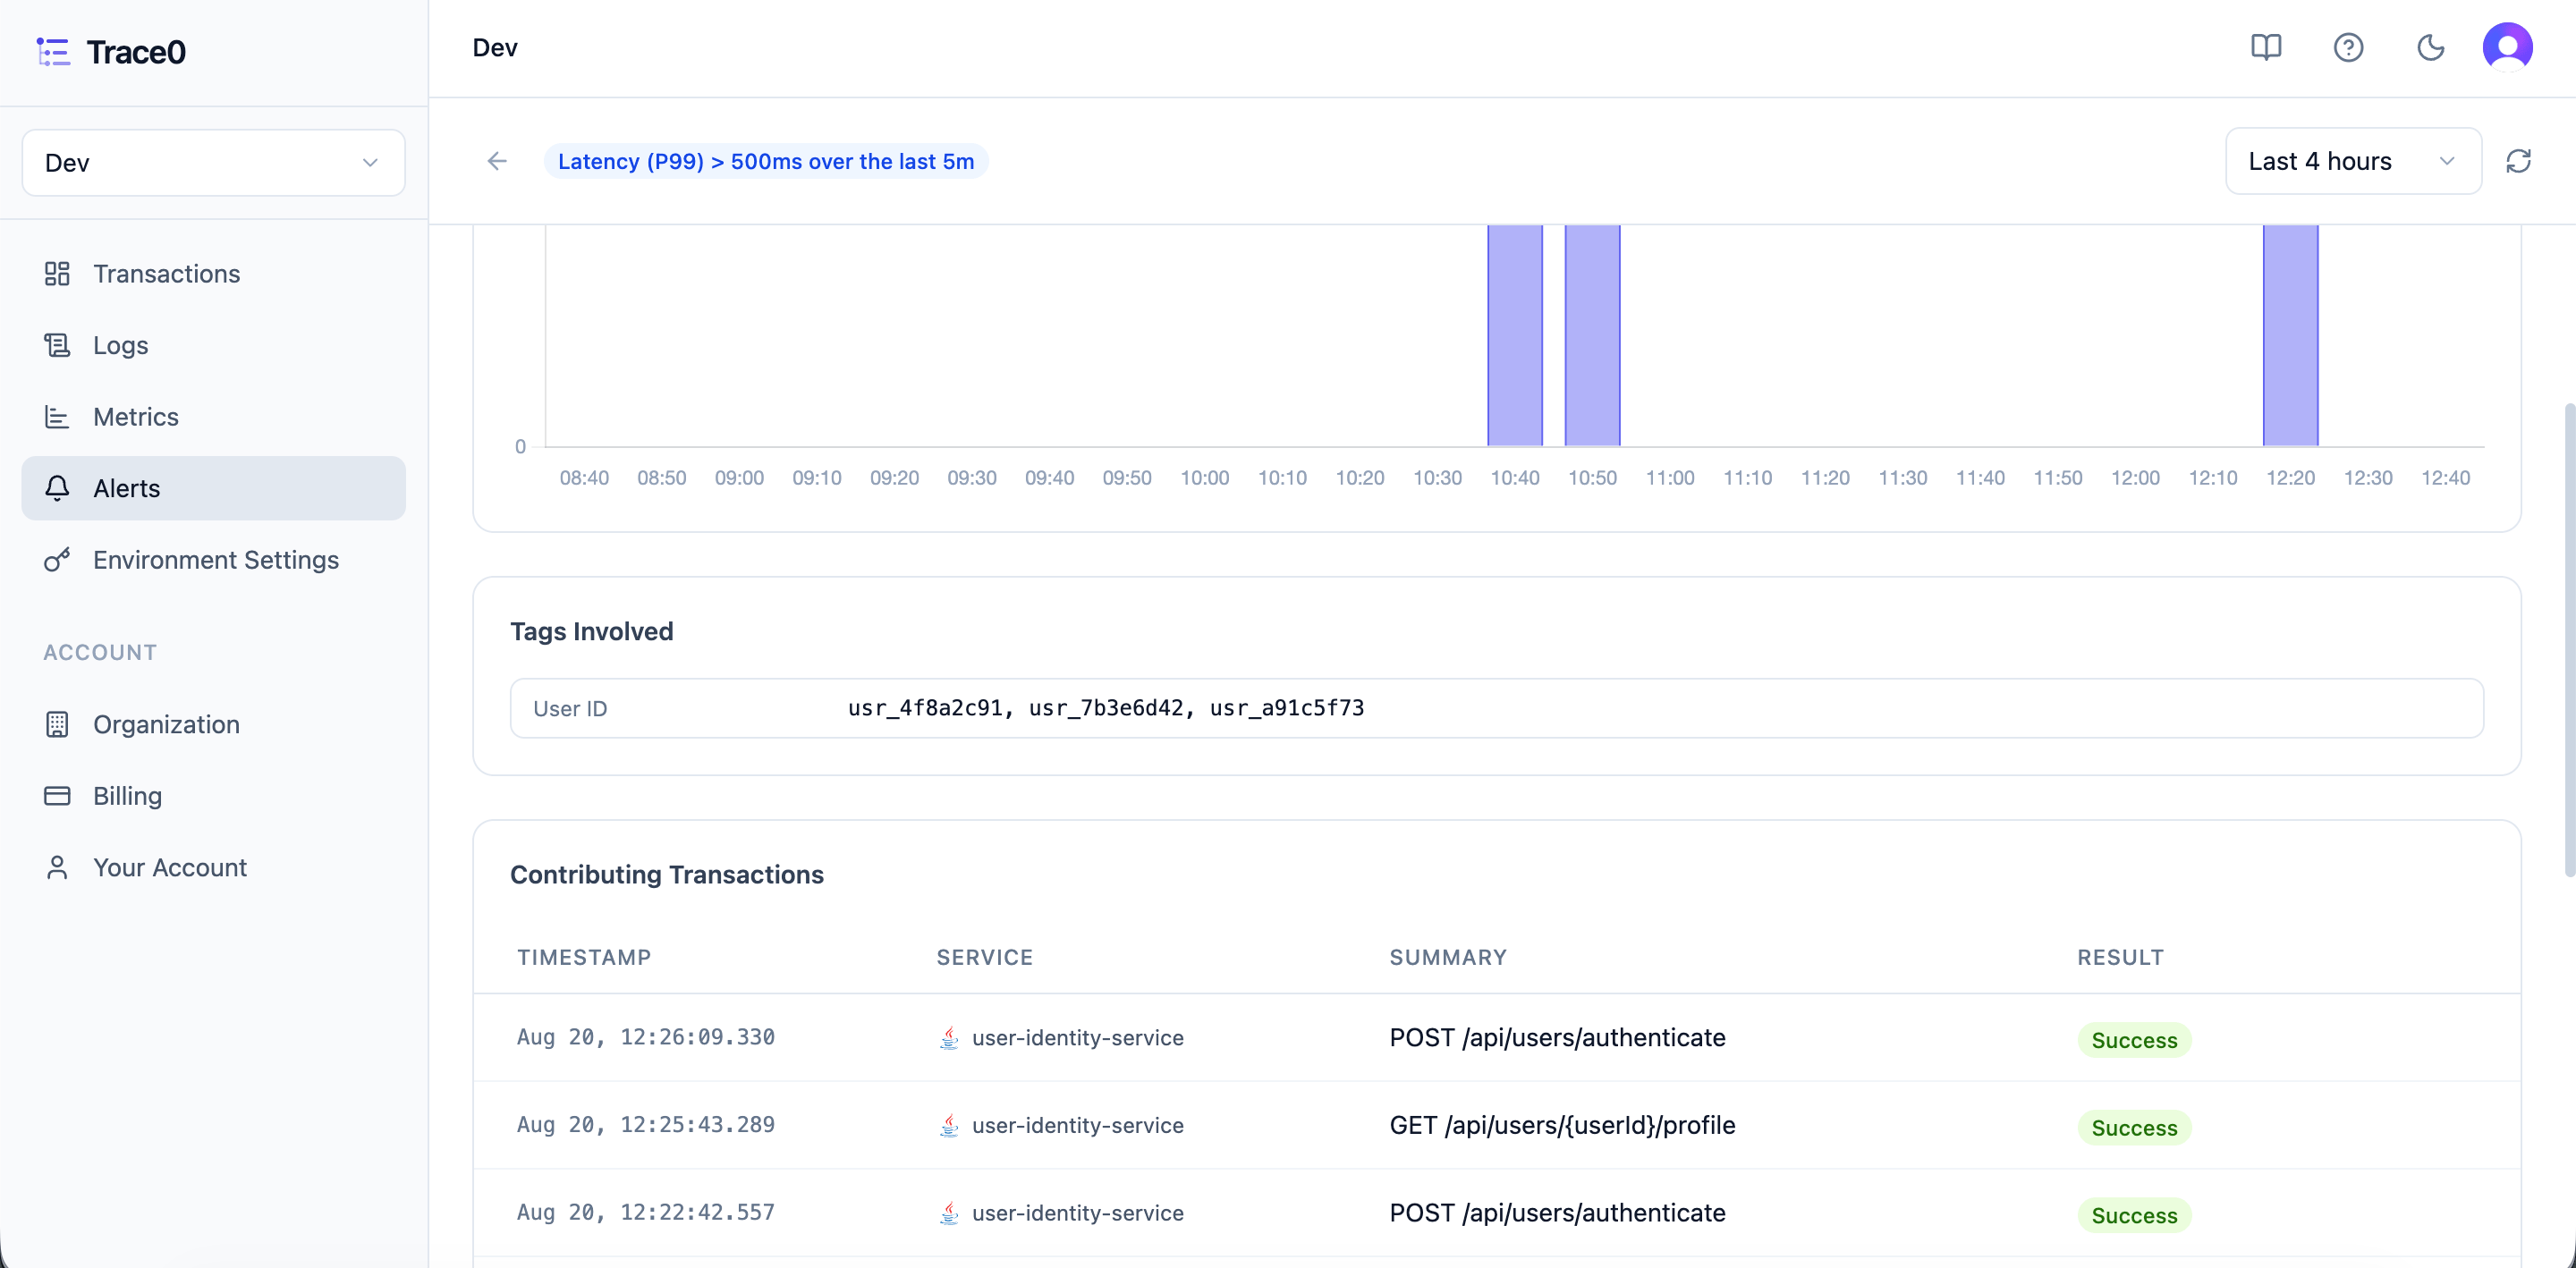
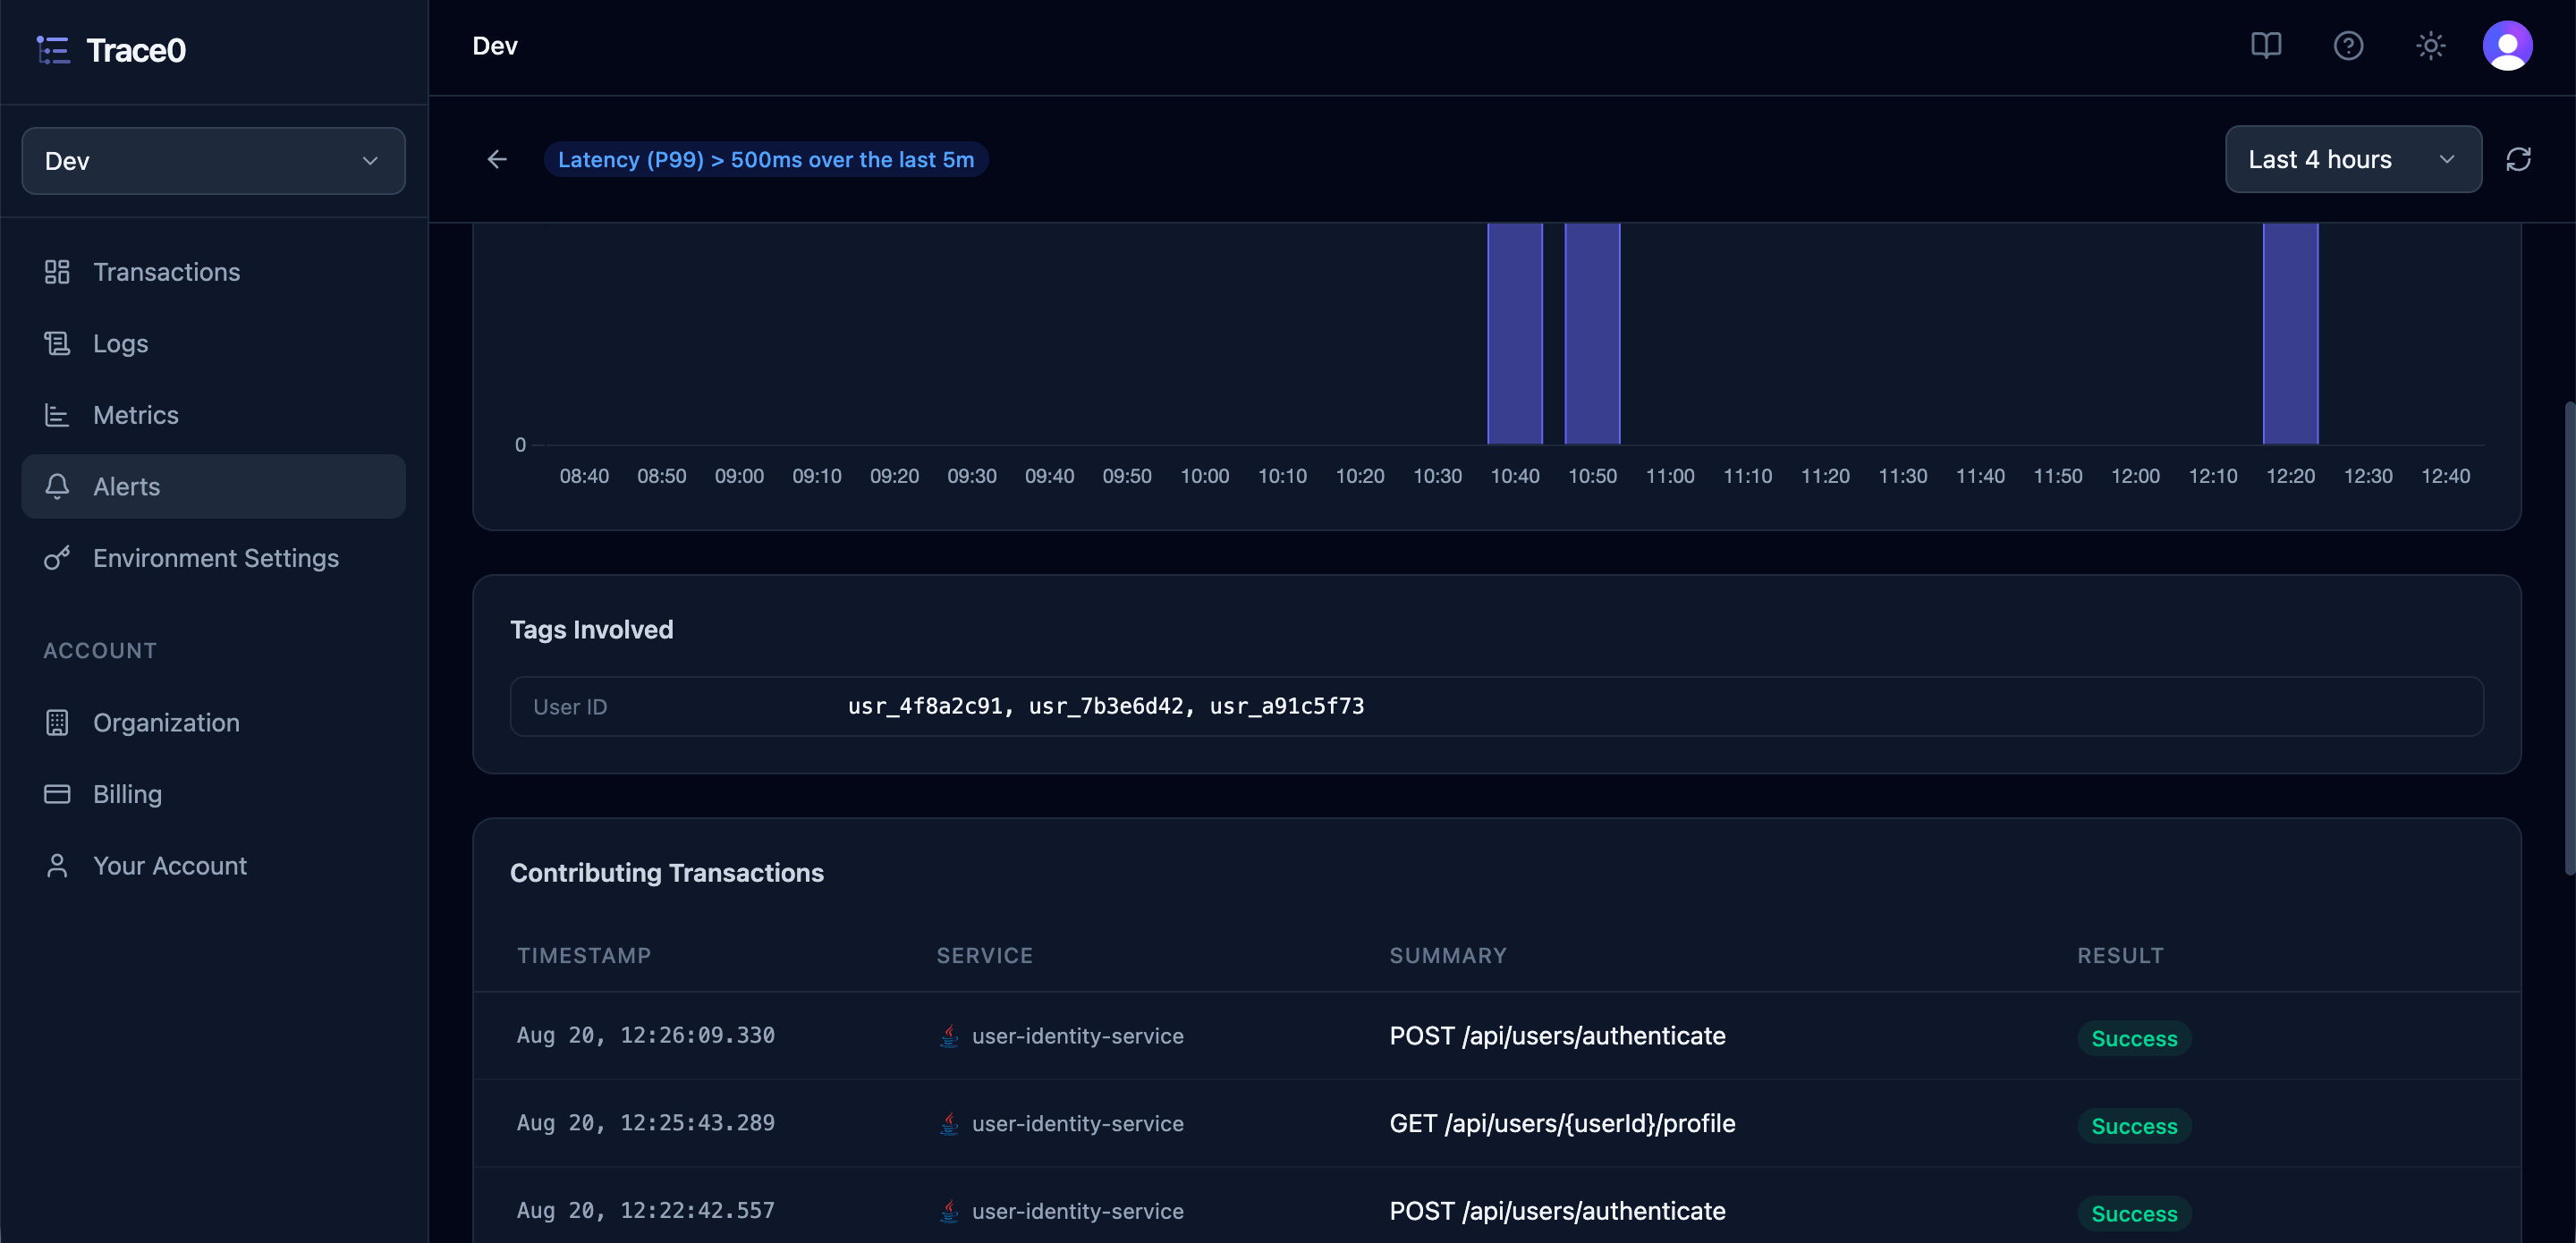
For triggered metric alerts, you can view the alert Volume Over Time, the Tags Involved to understand which users, customers, orders, or other business entities were affected, and the Contributing Transactions that led to the metric threshold being exceeded.