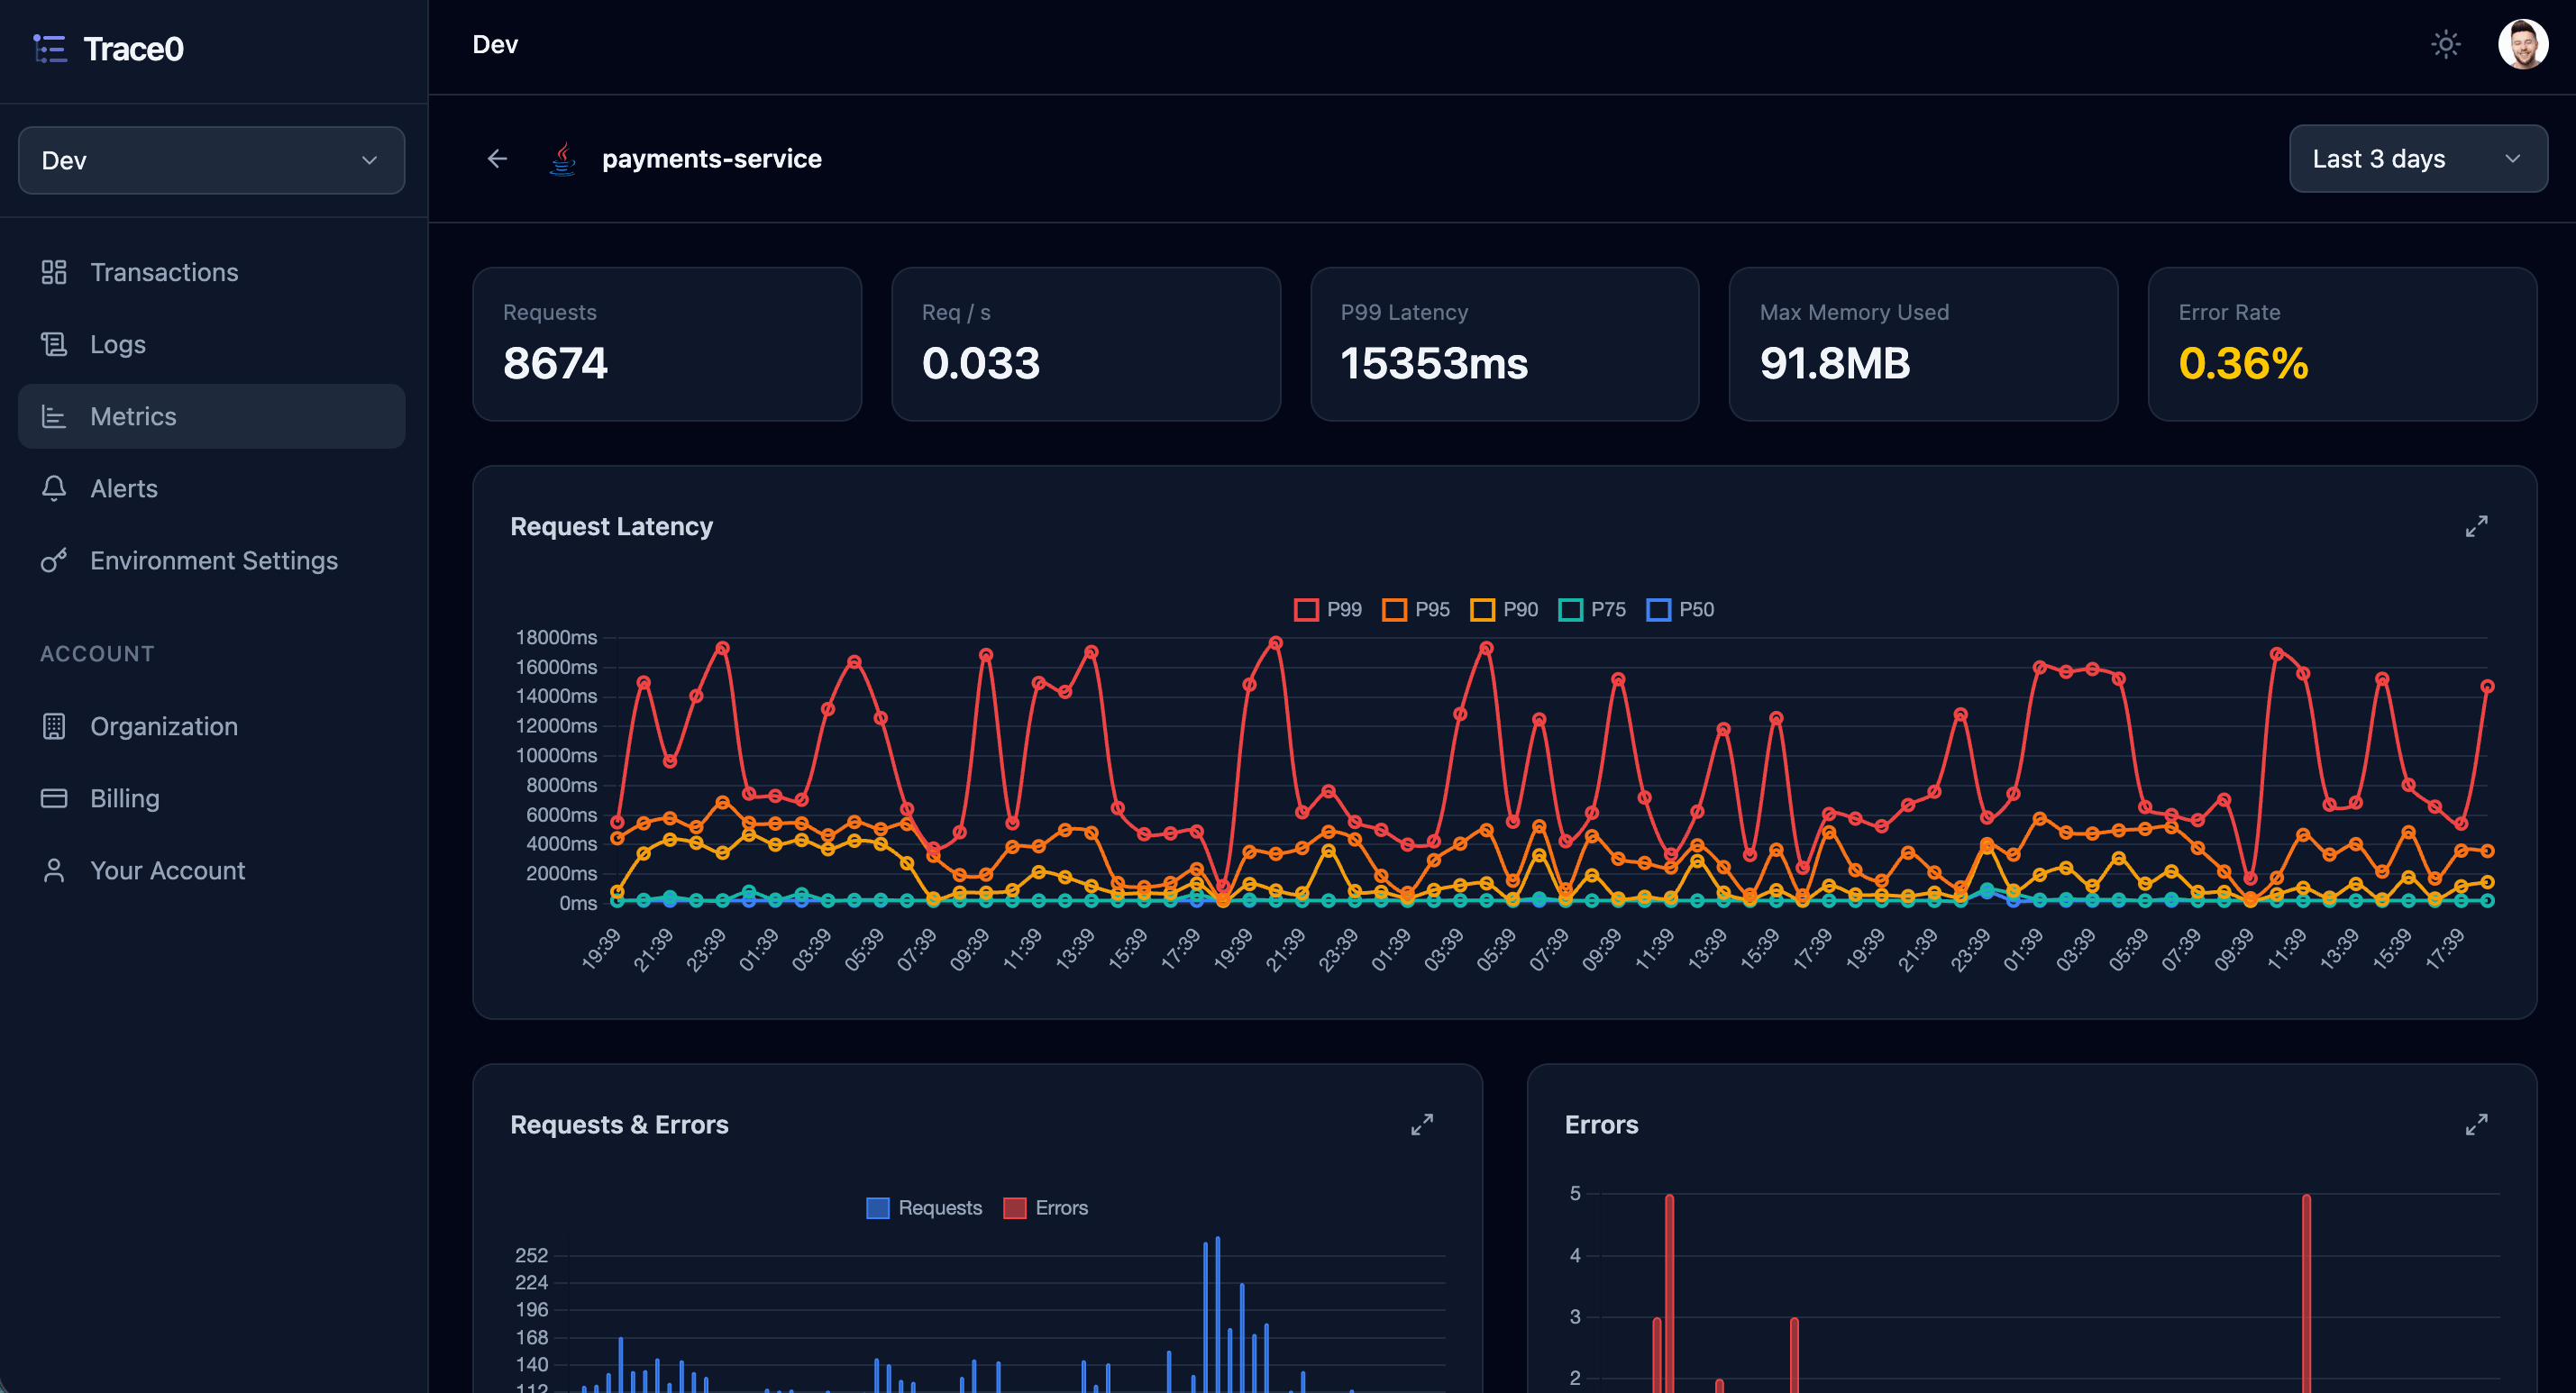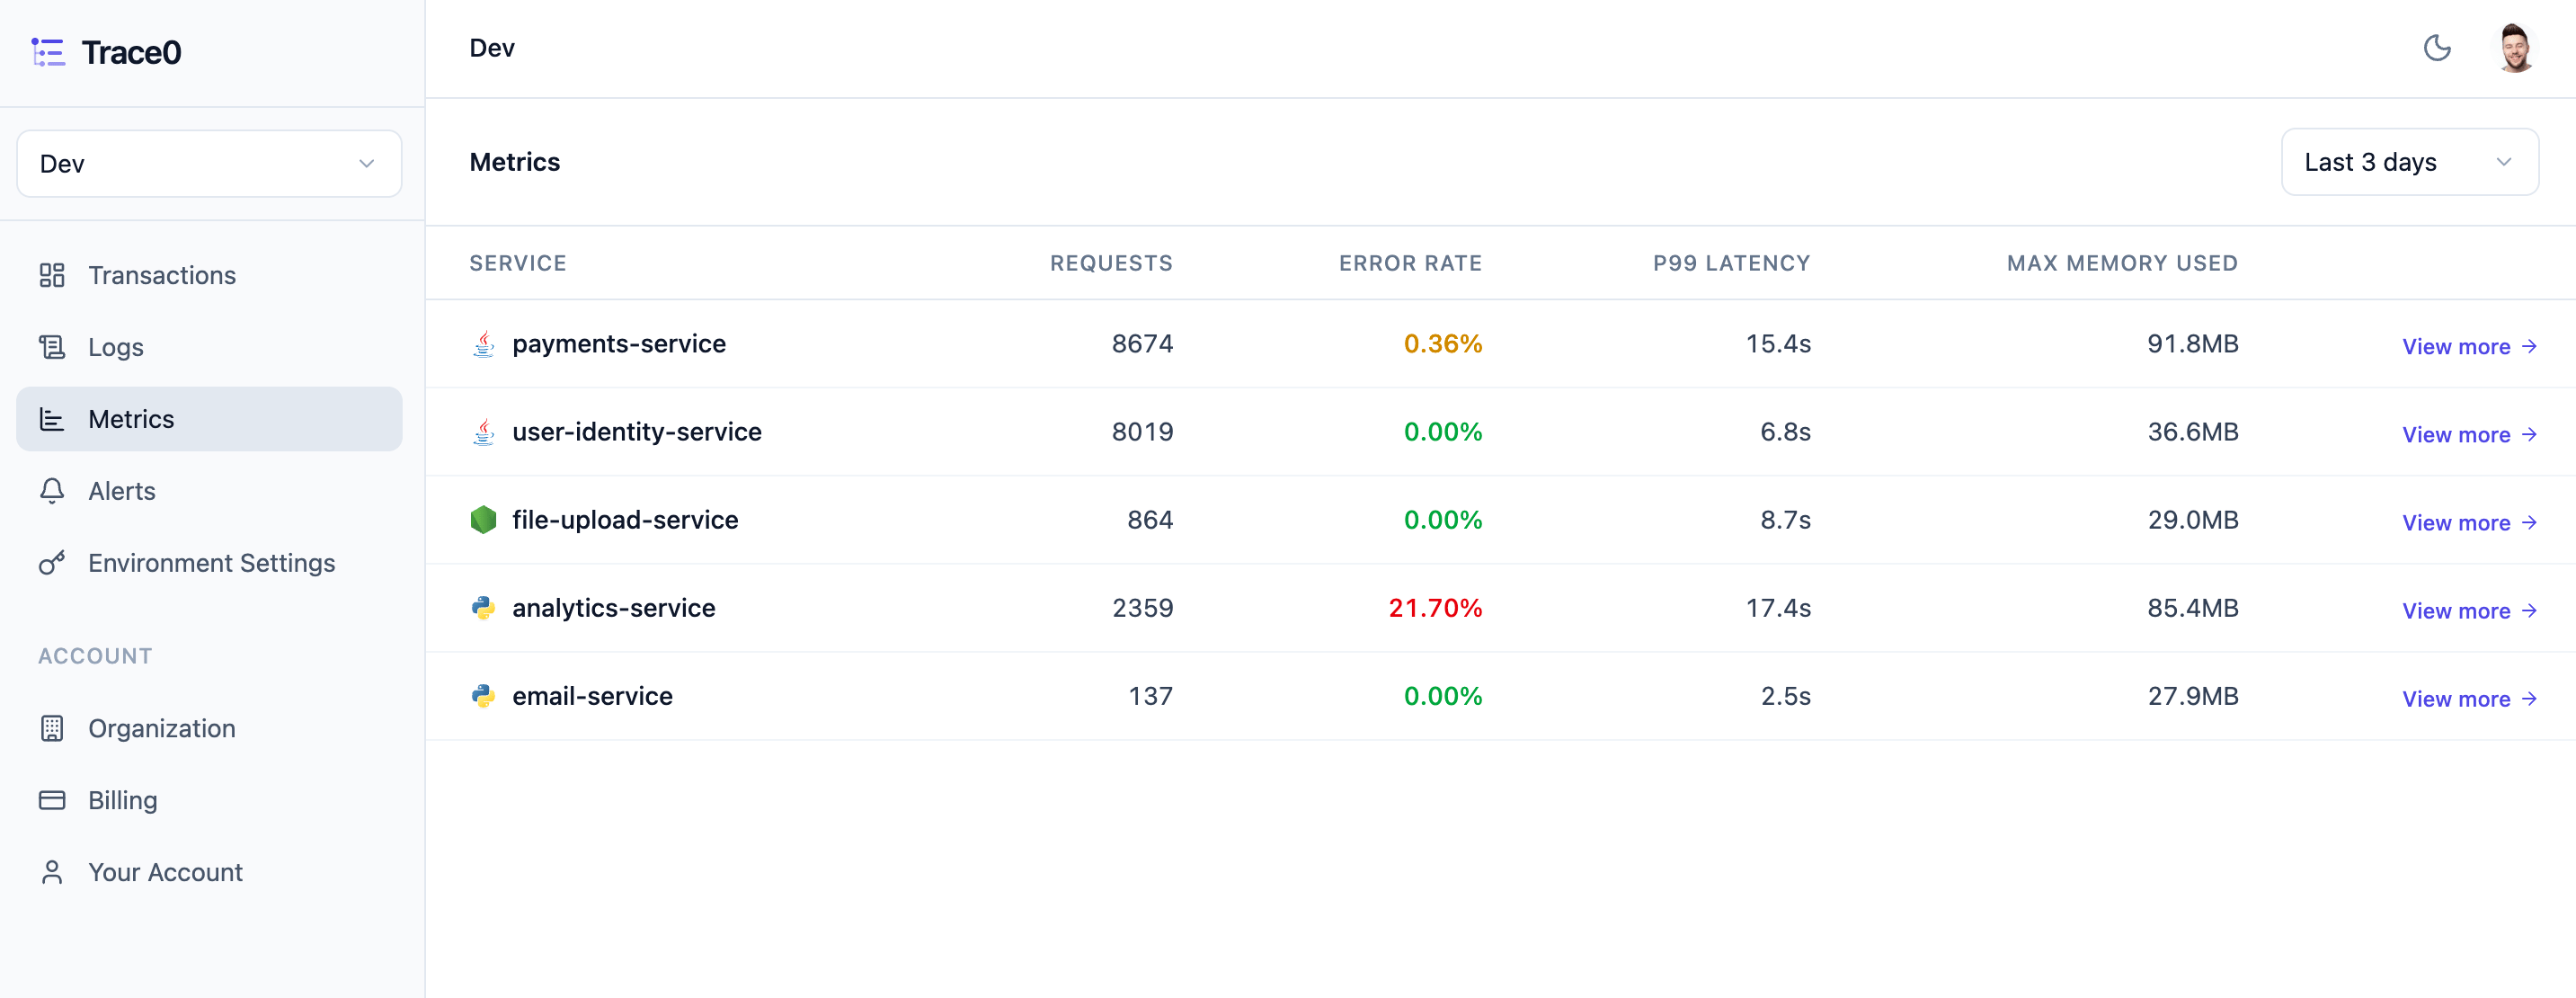
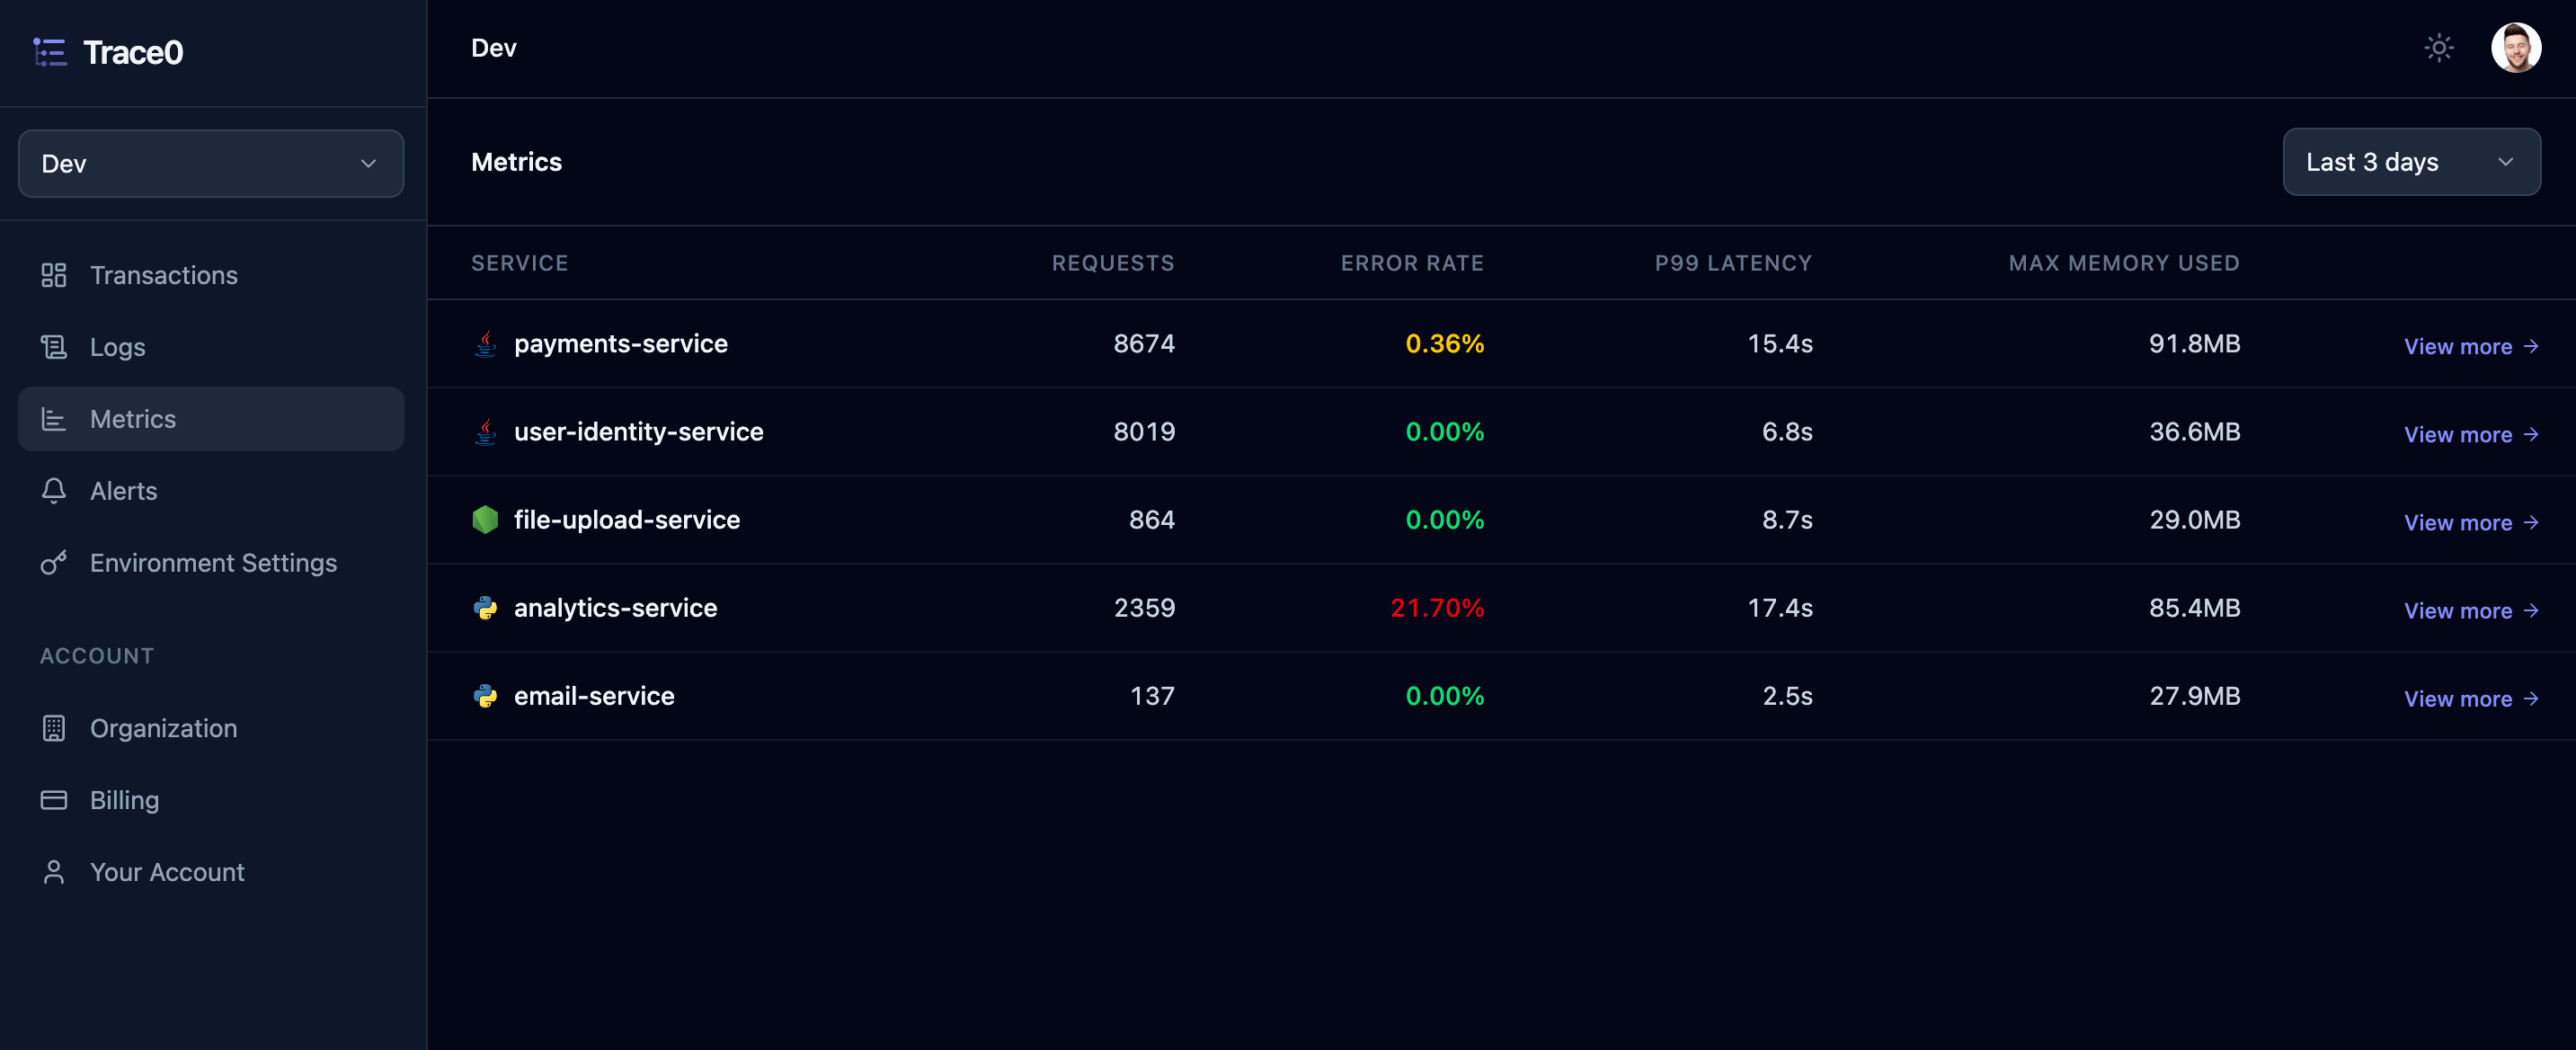
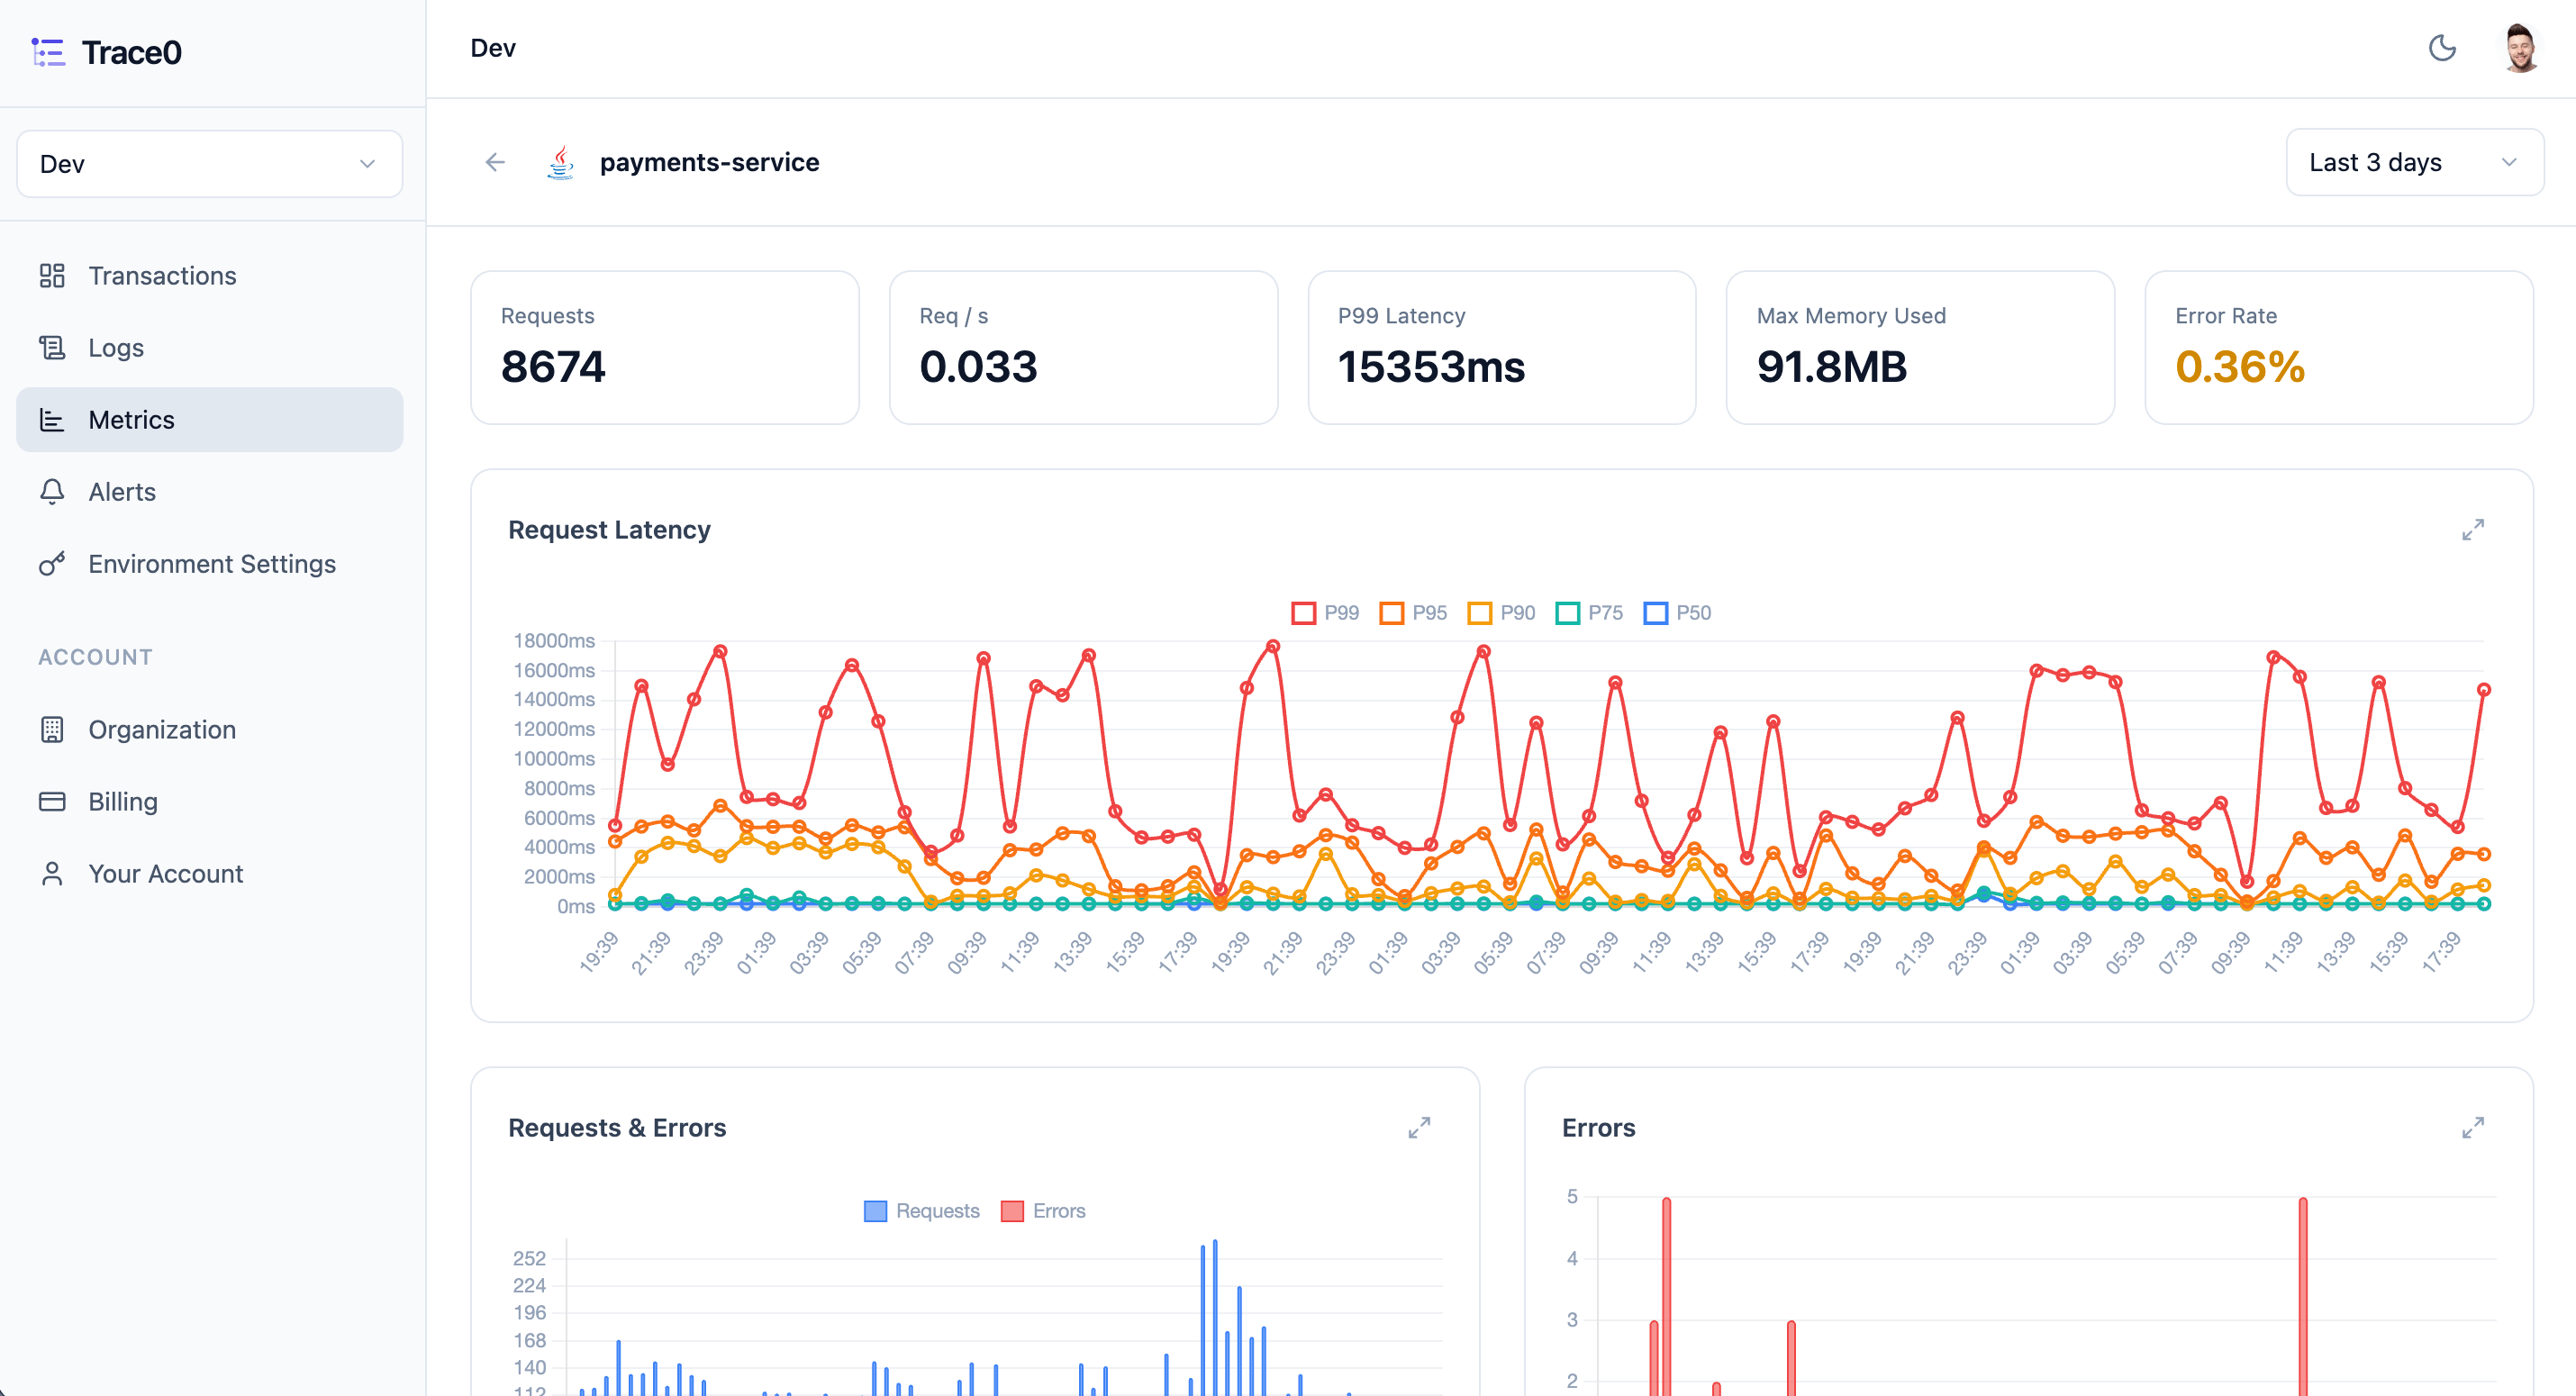
Trace0 provides detailed application metrics for each of your services, so you can easily monitor request latency, error rates, memory usage, and more, all displayed in clear, easy-to-read dashboards. You can view application metrics for your services in the Metrics section. You will see some high level application metrics for each service, which can be filtered by time period: Metrics Light Metrics Light You can then click the View more link for any service to view detailed application metrics and dashboards for that service: Metrics Light Metrics Light
Displayed Metrics

We currently display the following application metrics for each language/runtime. Metrics are displayed either as a single value or as a chart.
Single ValueChart
If you require other metrics to be displayed, please email hello@trace0hq.com.