
Introduction
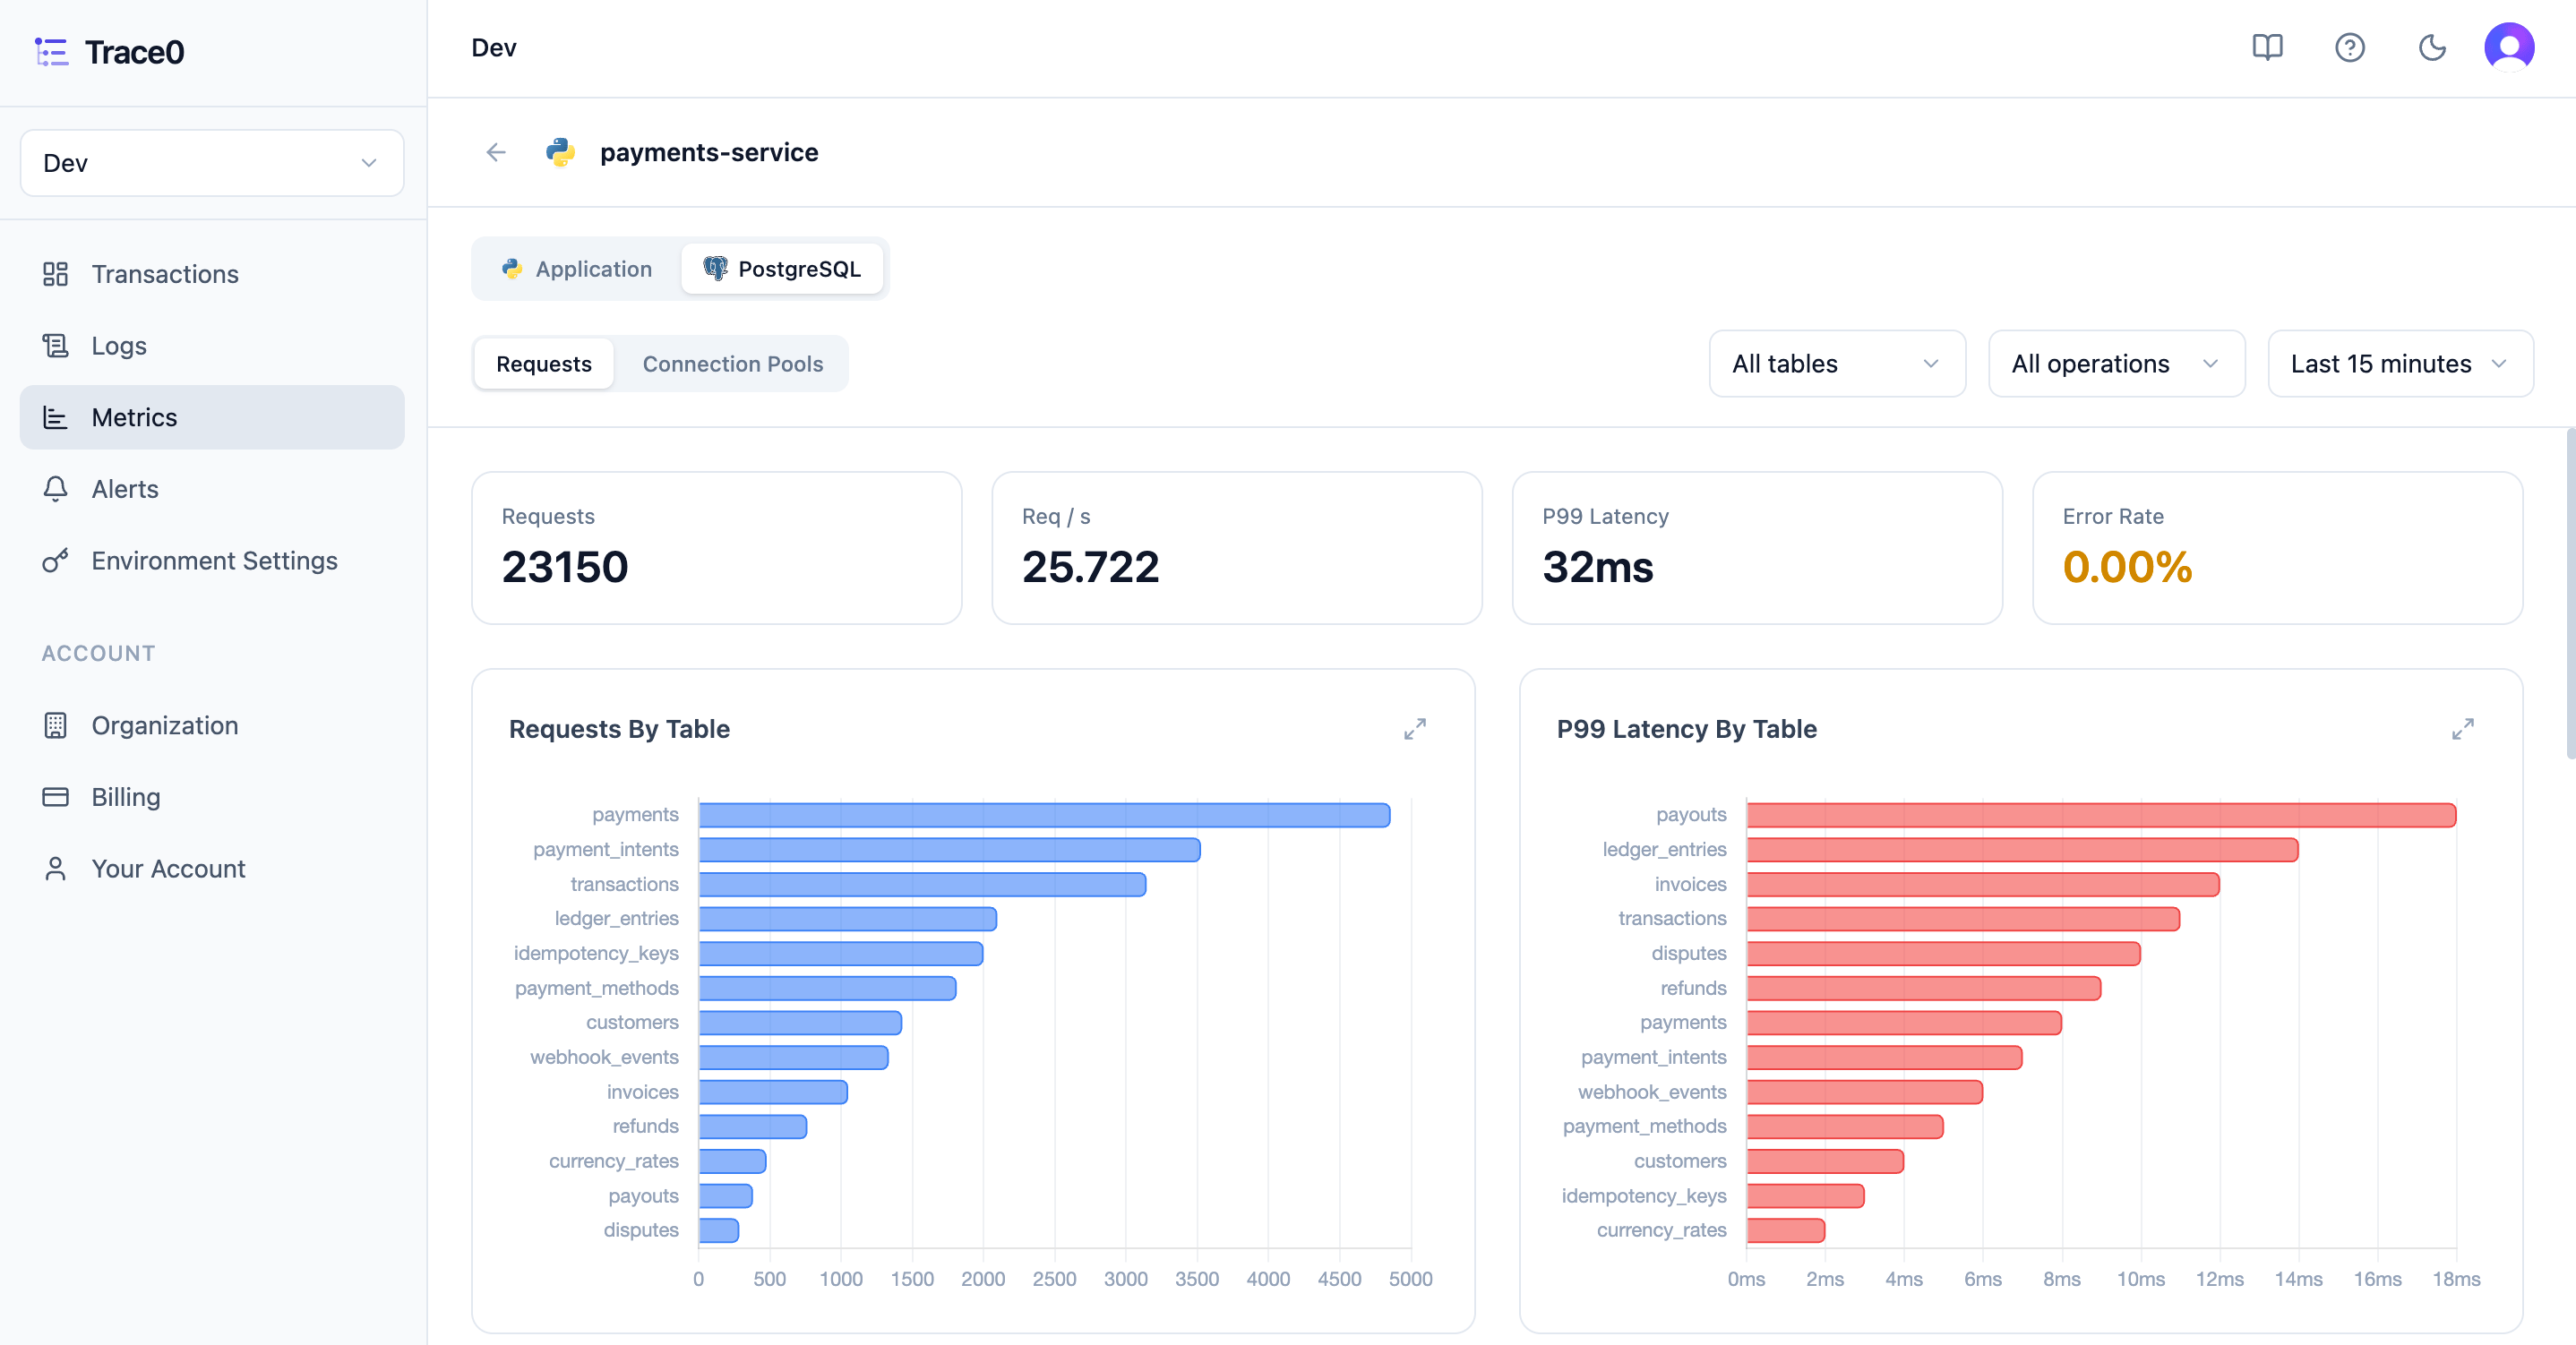
Trace0 provides detailed metrics for PostgreSQL, a powerful, object-relational database system. Metrics are based on the OpenTelemetry semantic conventions for PostgreSQL client operations. To view metrics for PostgreSQL for a service, click into the Metrics section, click theView more link for your service, then click the PostgreSQL toggle.
Displayed Metrics
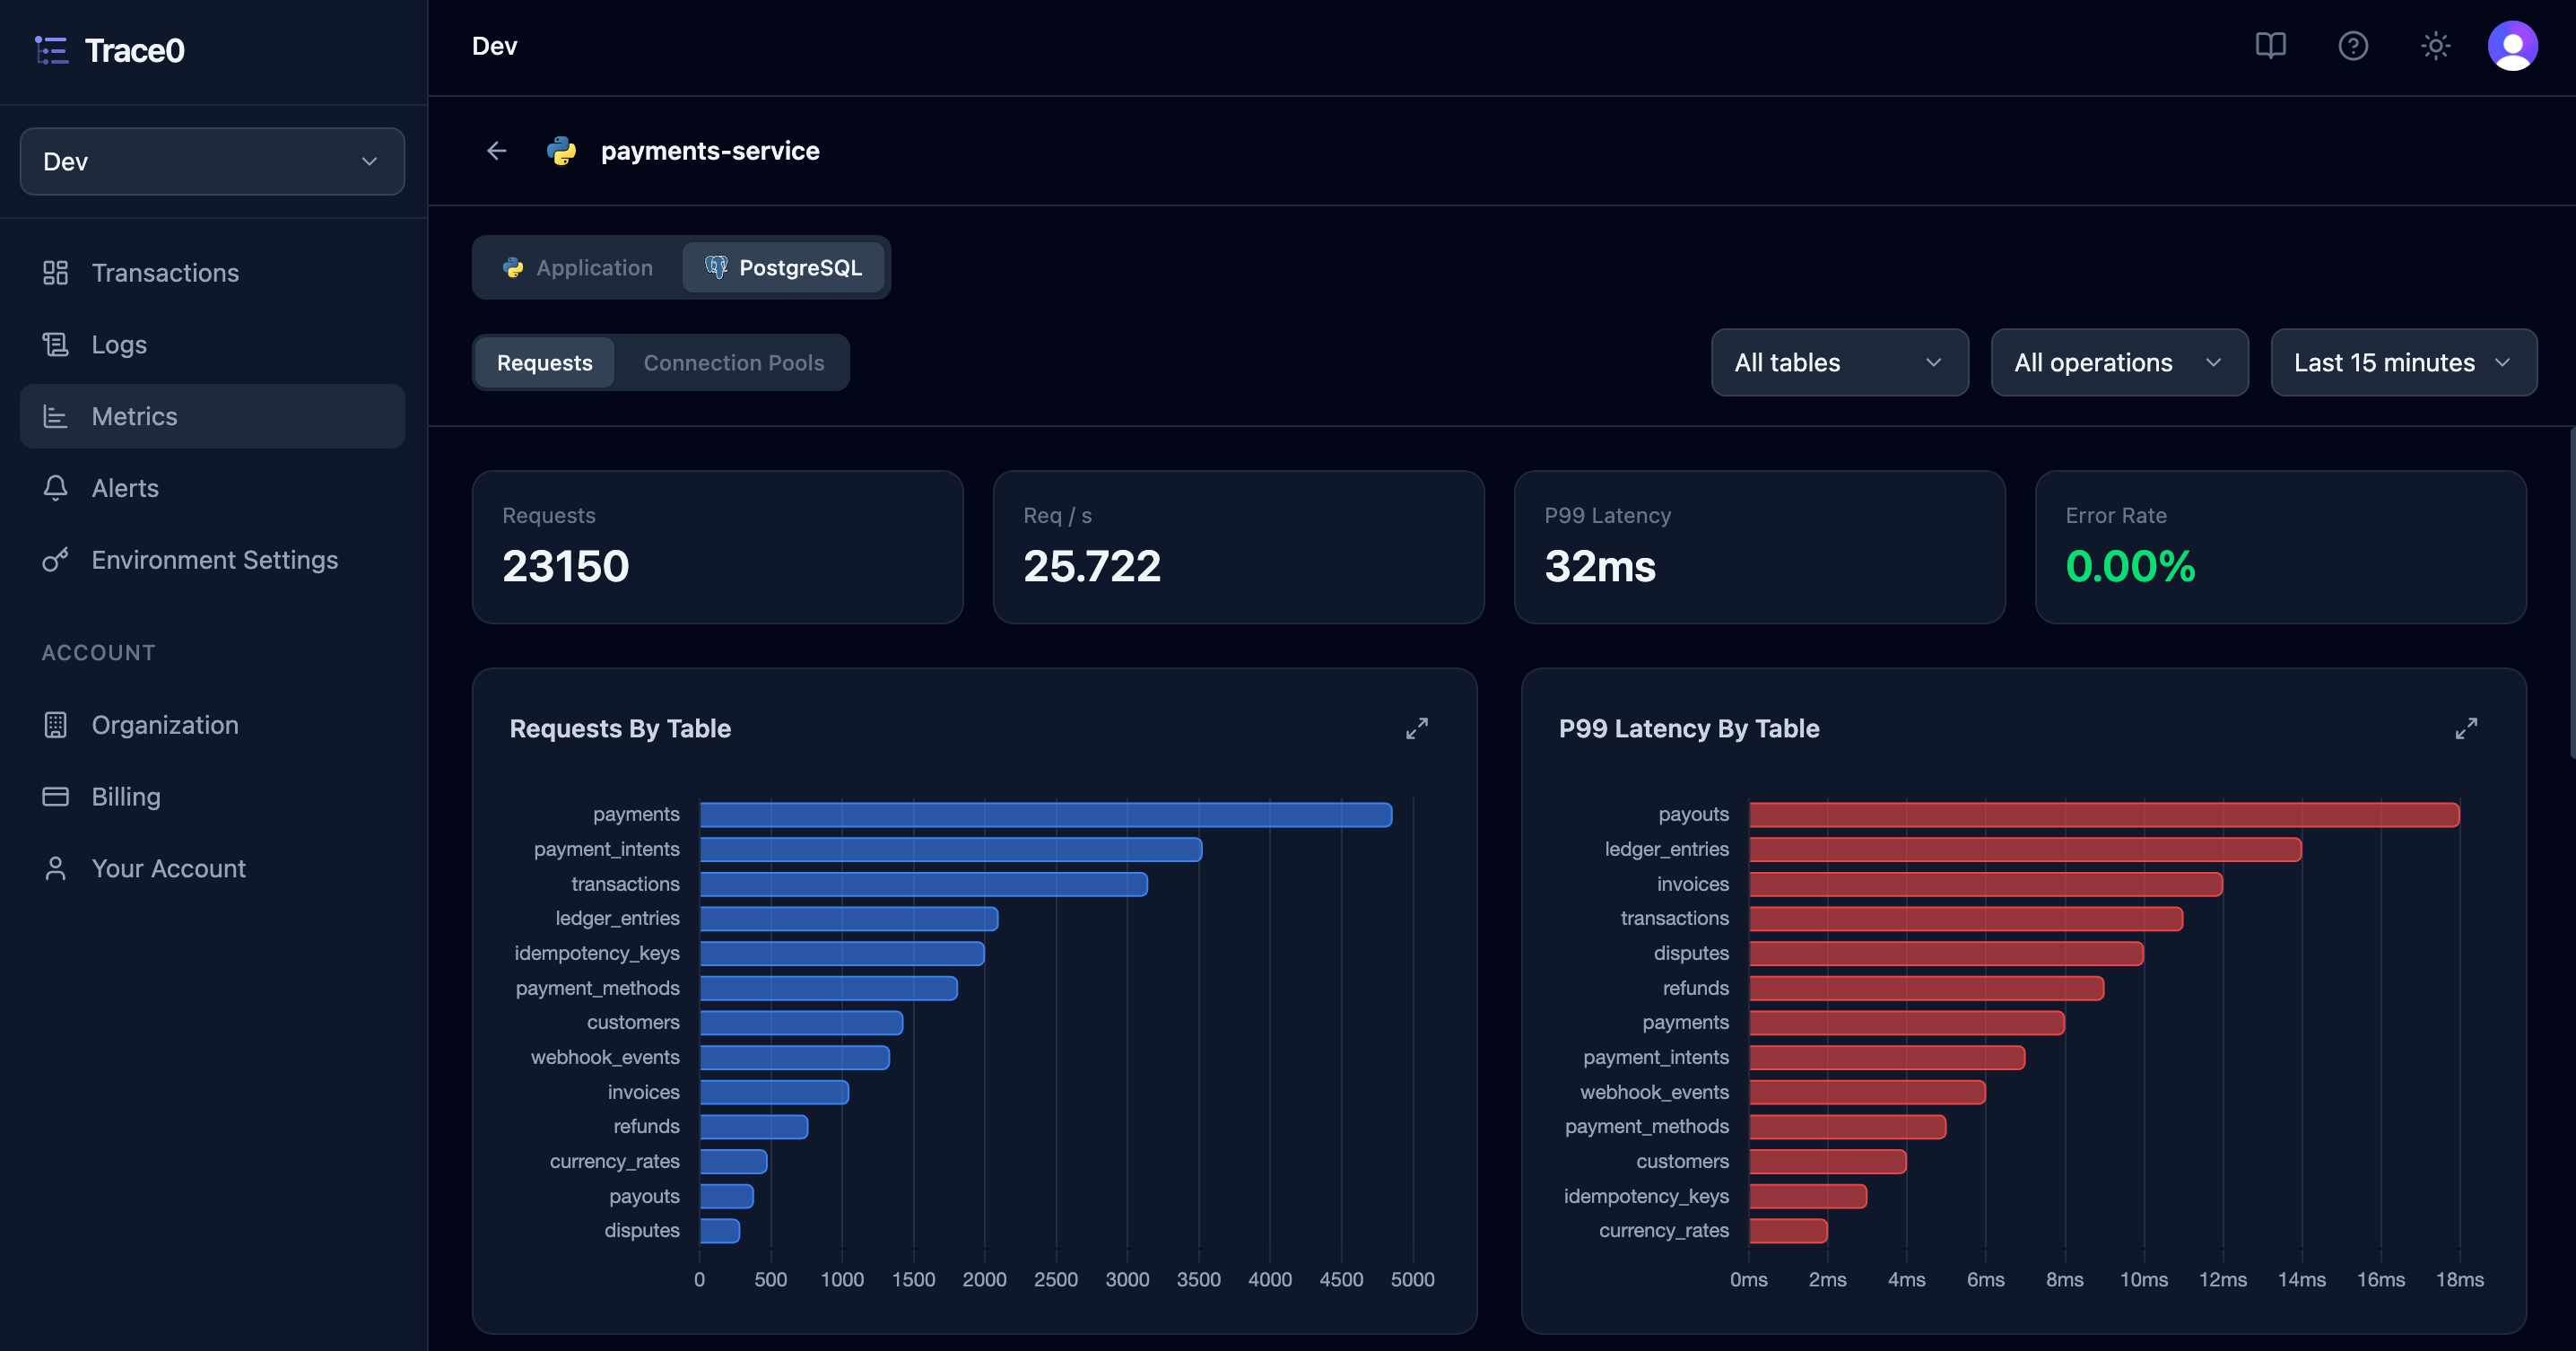
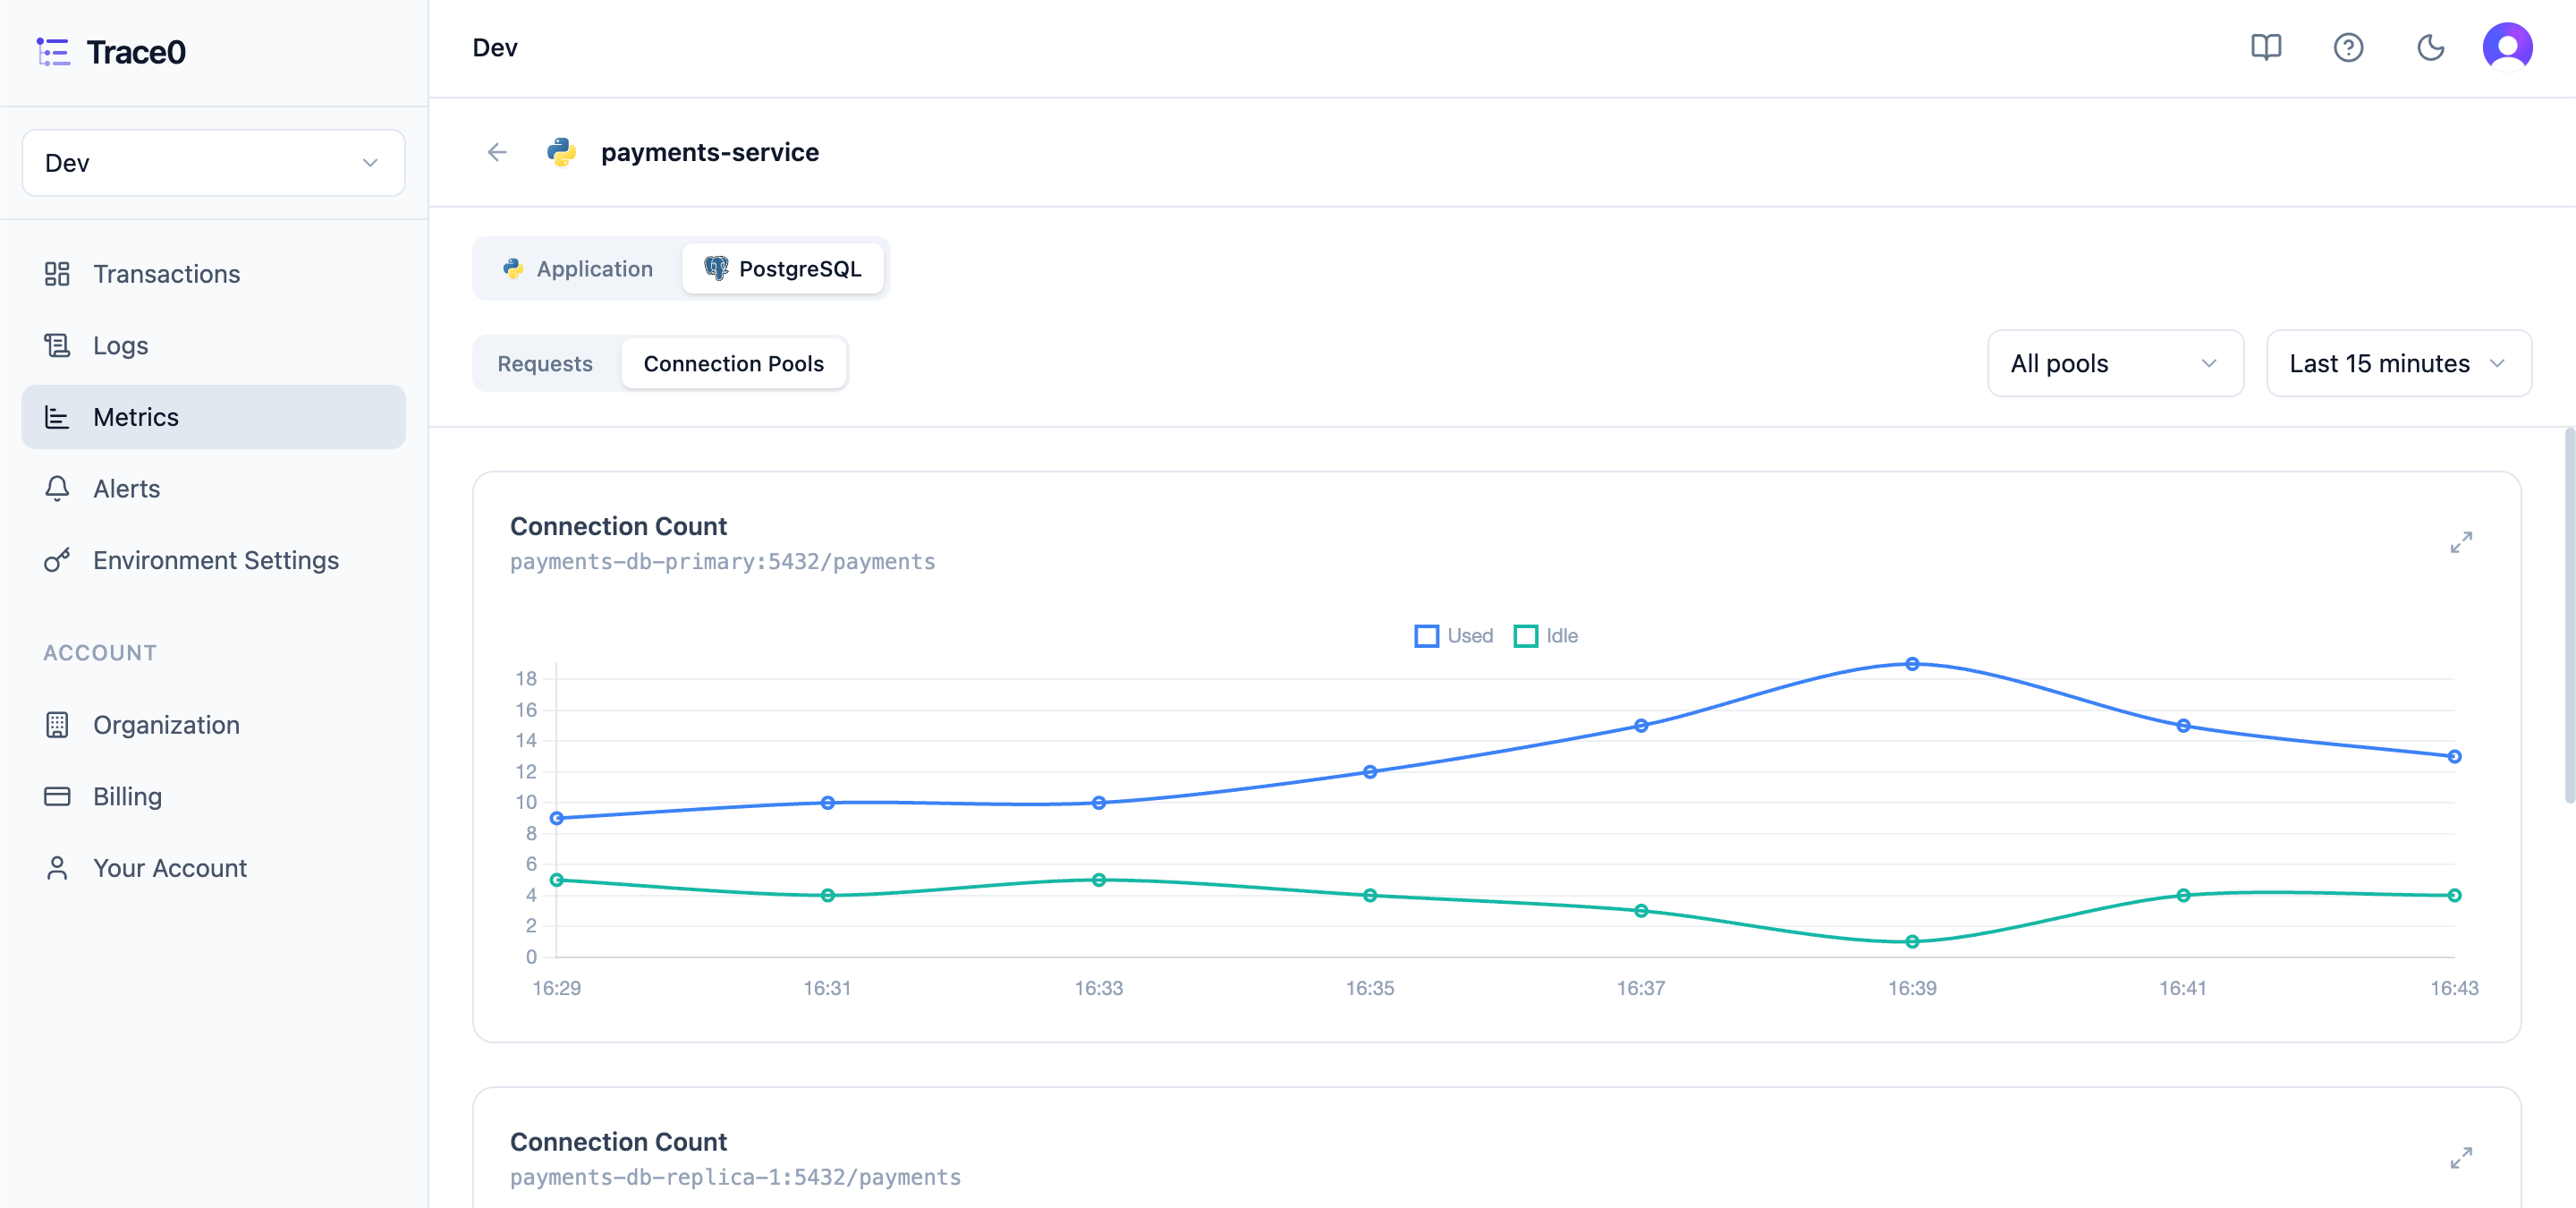
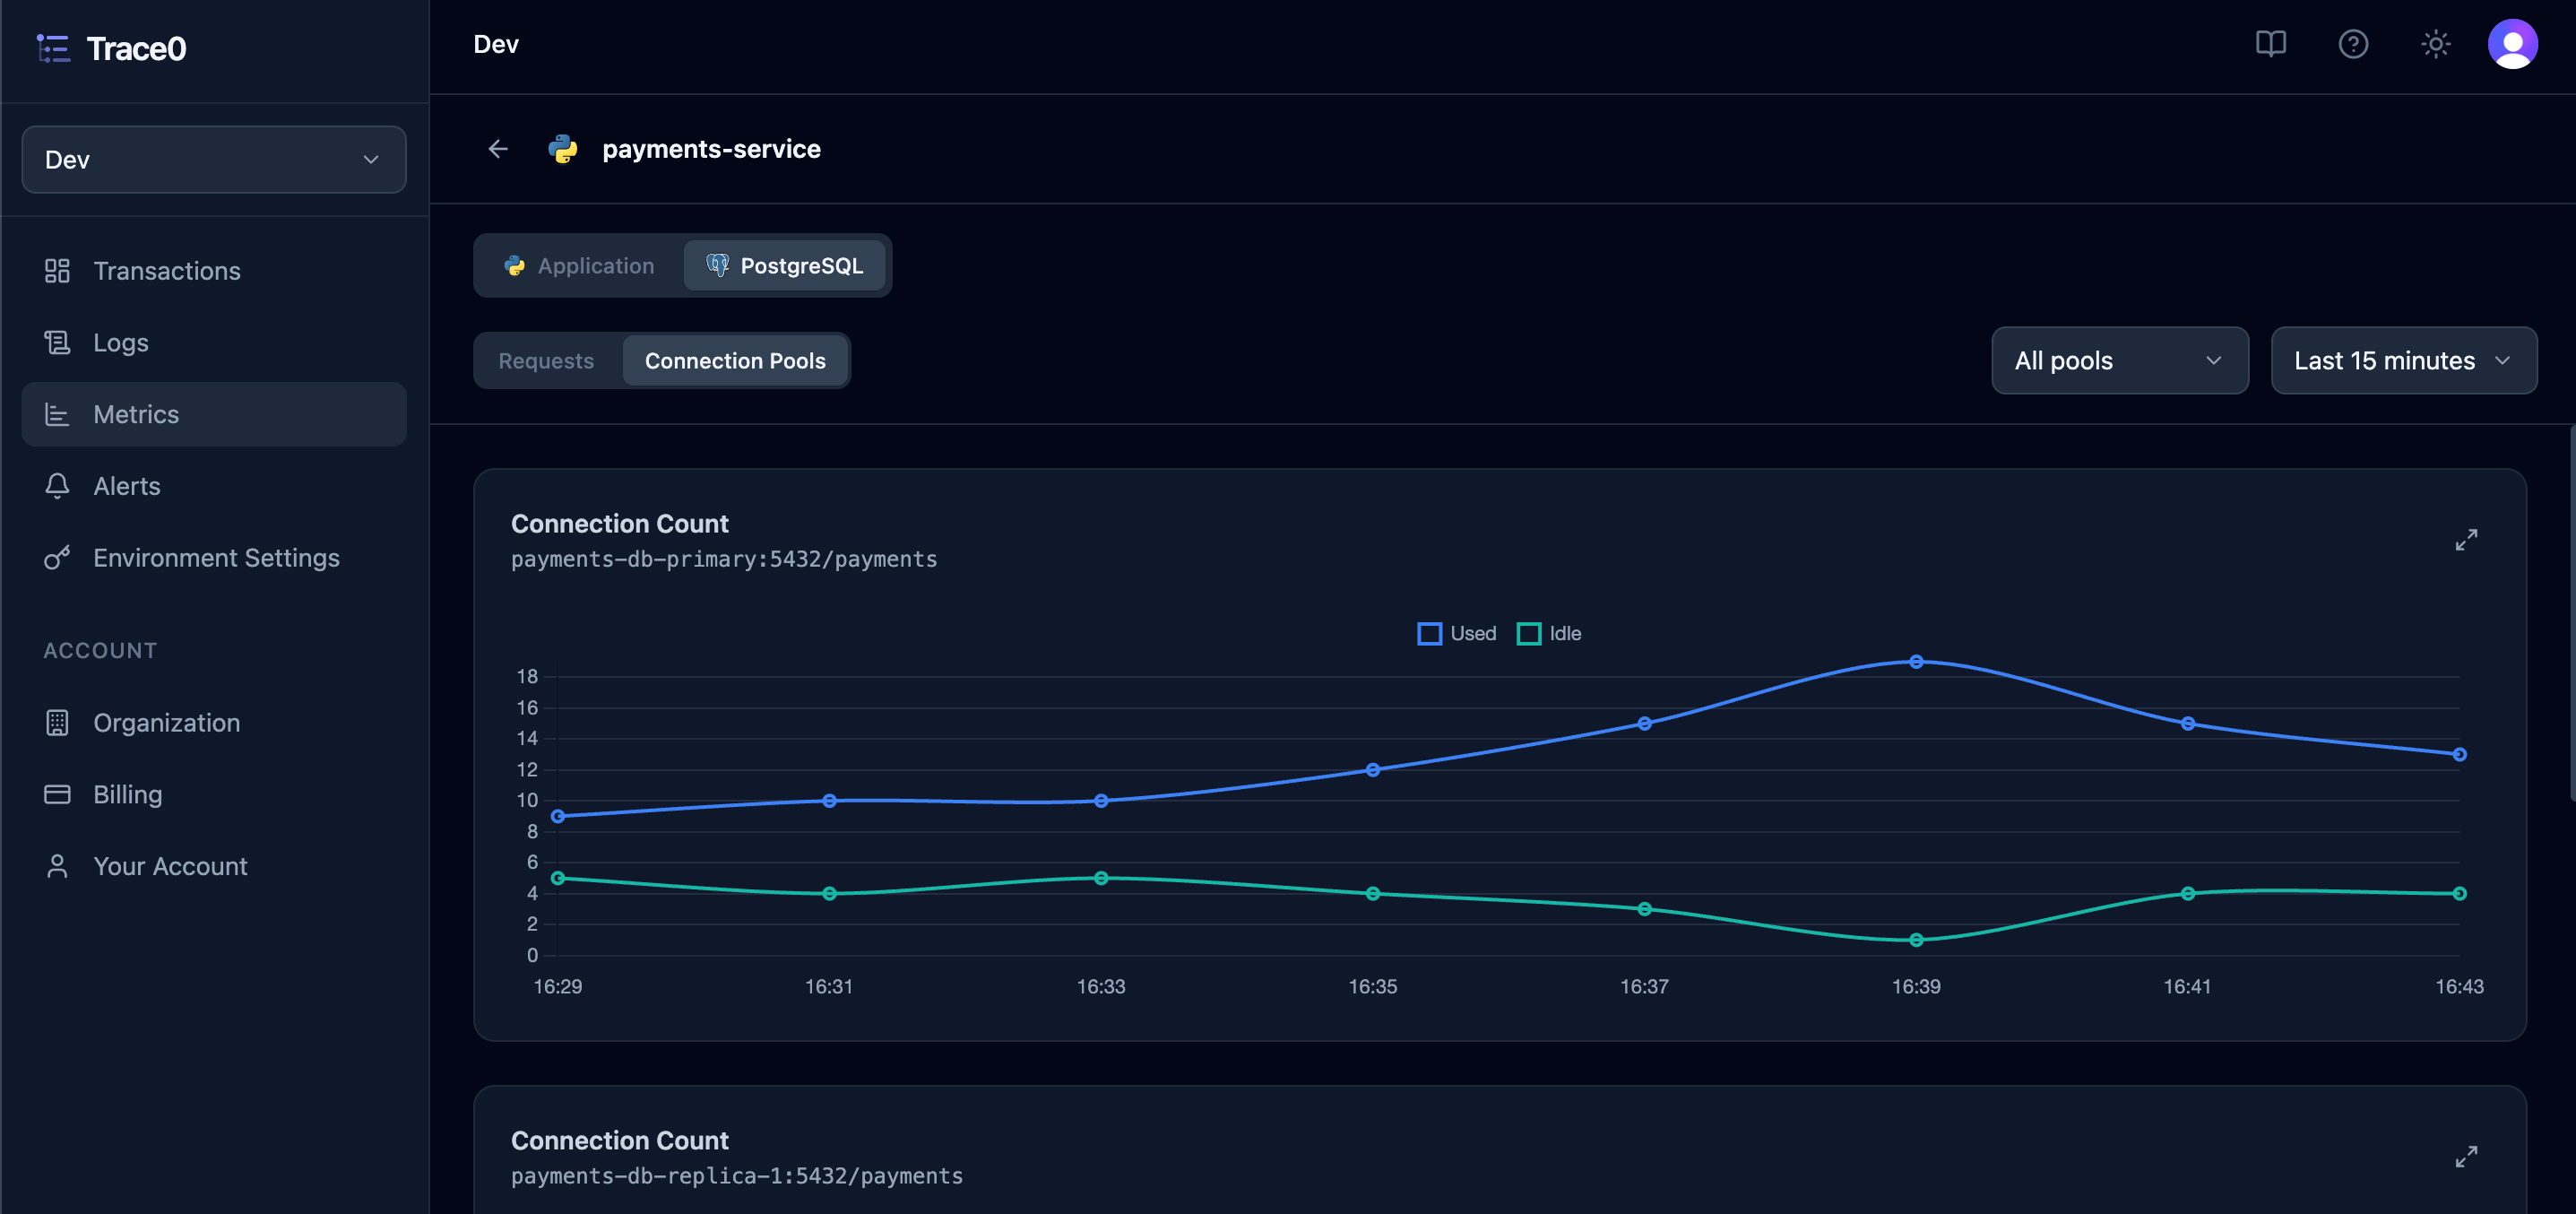
We currently display the following PostgreSQL metrics, broken intoRequests and Connection Pools sections.
The metrics are displayed either as a single value or as a chart.
- Requests
- Connection Pools
Single Value
Chart
SQL commands containing multiple statements are not attributed to a specific table or operation and are therefore excluded from request count and latency metrics for individual tables and operations.