
Intro
Trace0 provides a query language calledTrace0QL (Trace0 Query Language) that lets you search transactions in Trace0.
It is similar to Grafana’s TraceQL, but simpler to read and write, with native support for querying transaction logs and tags.
A Trace0QL query is a list of conditions, combined with AND and OR.
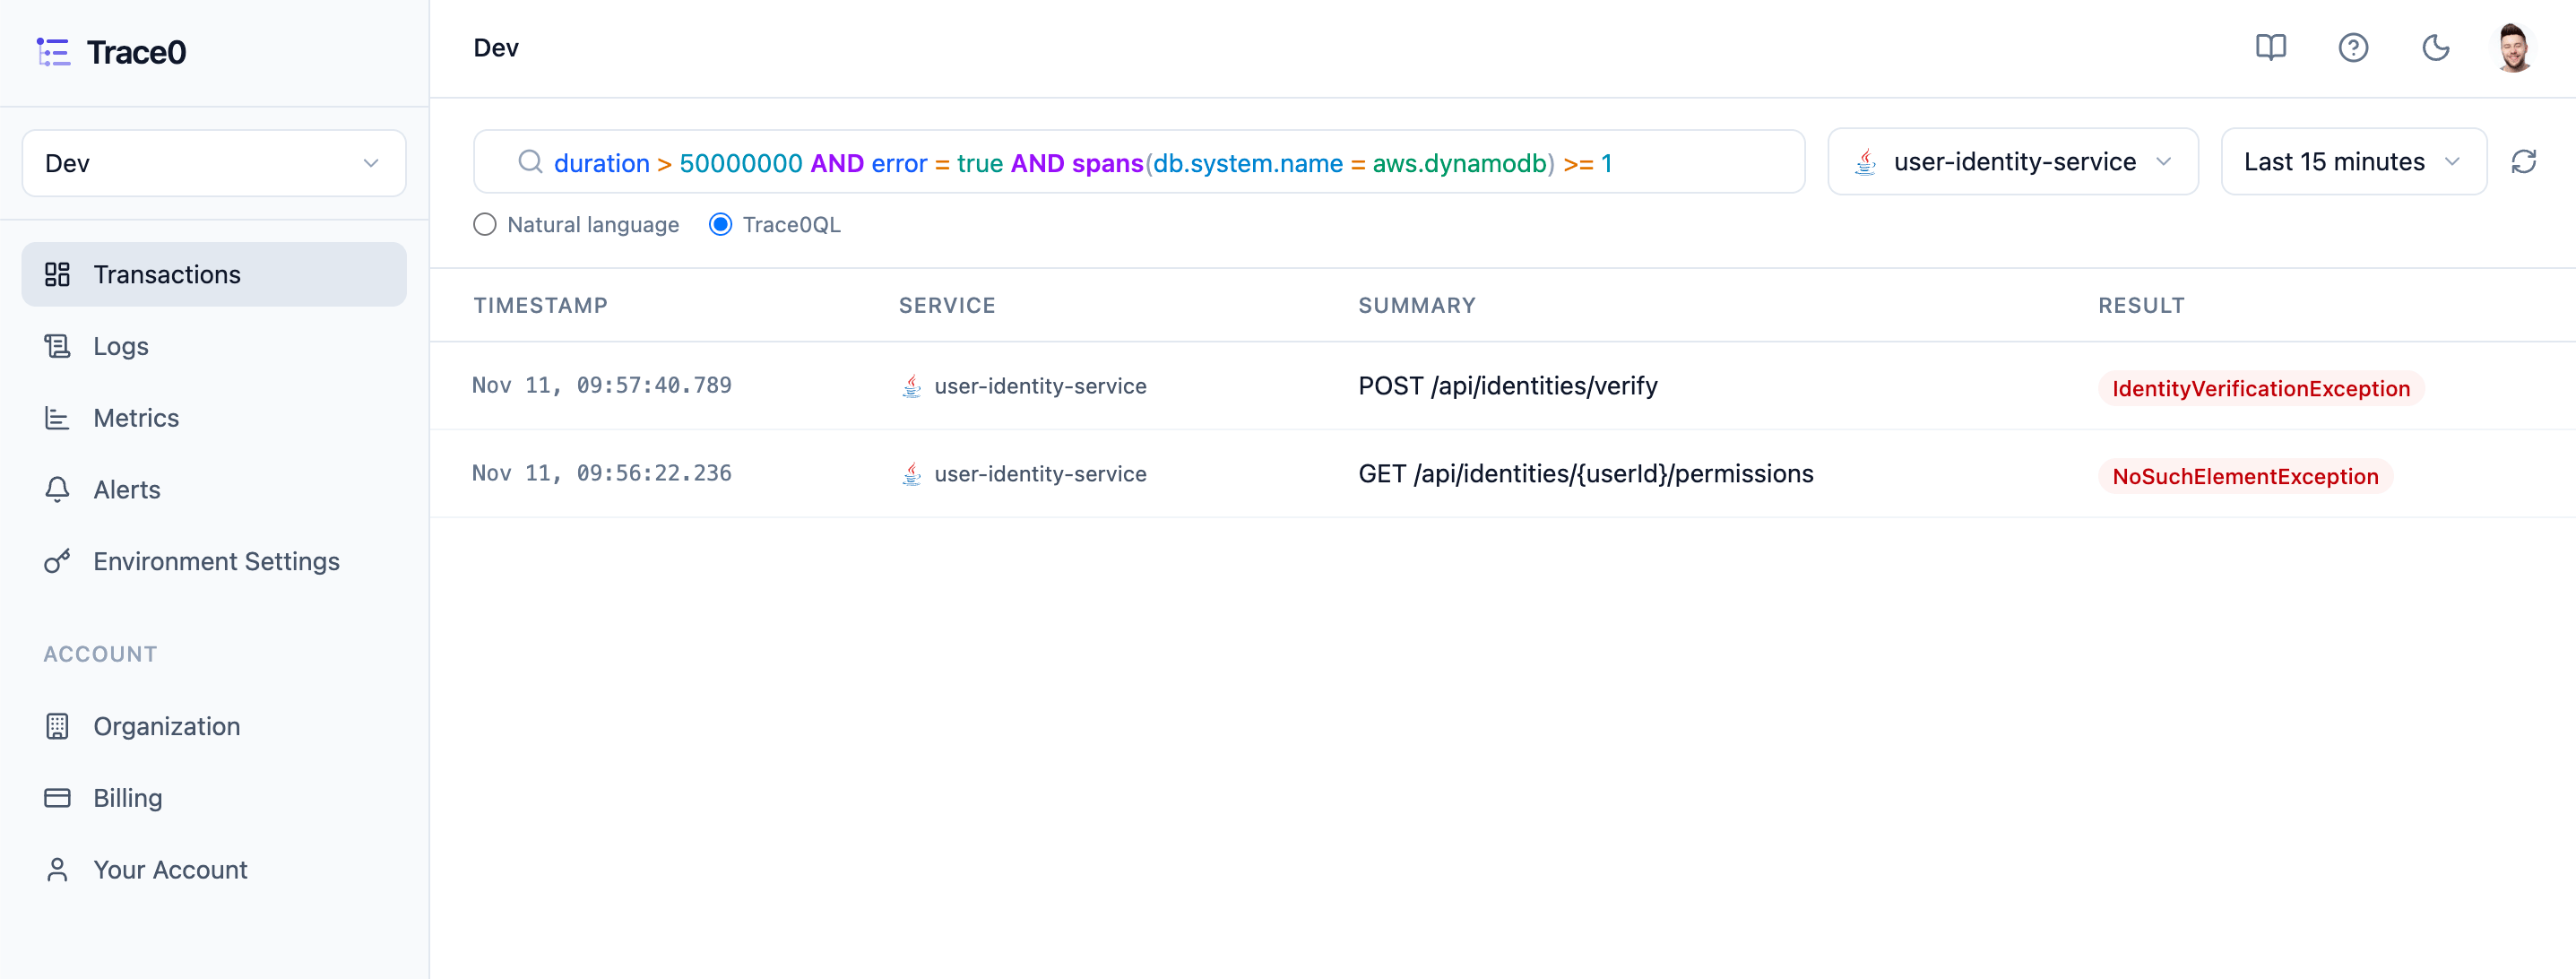
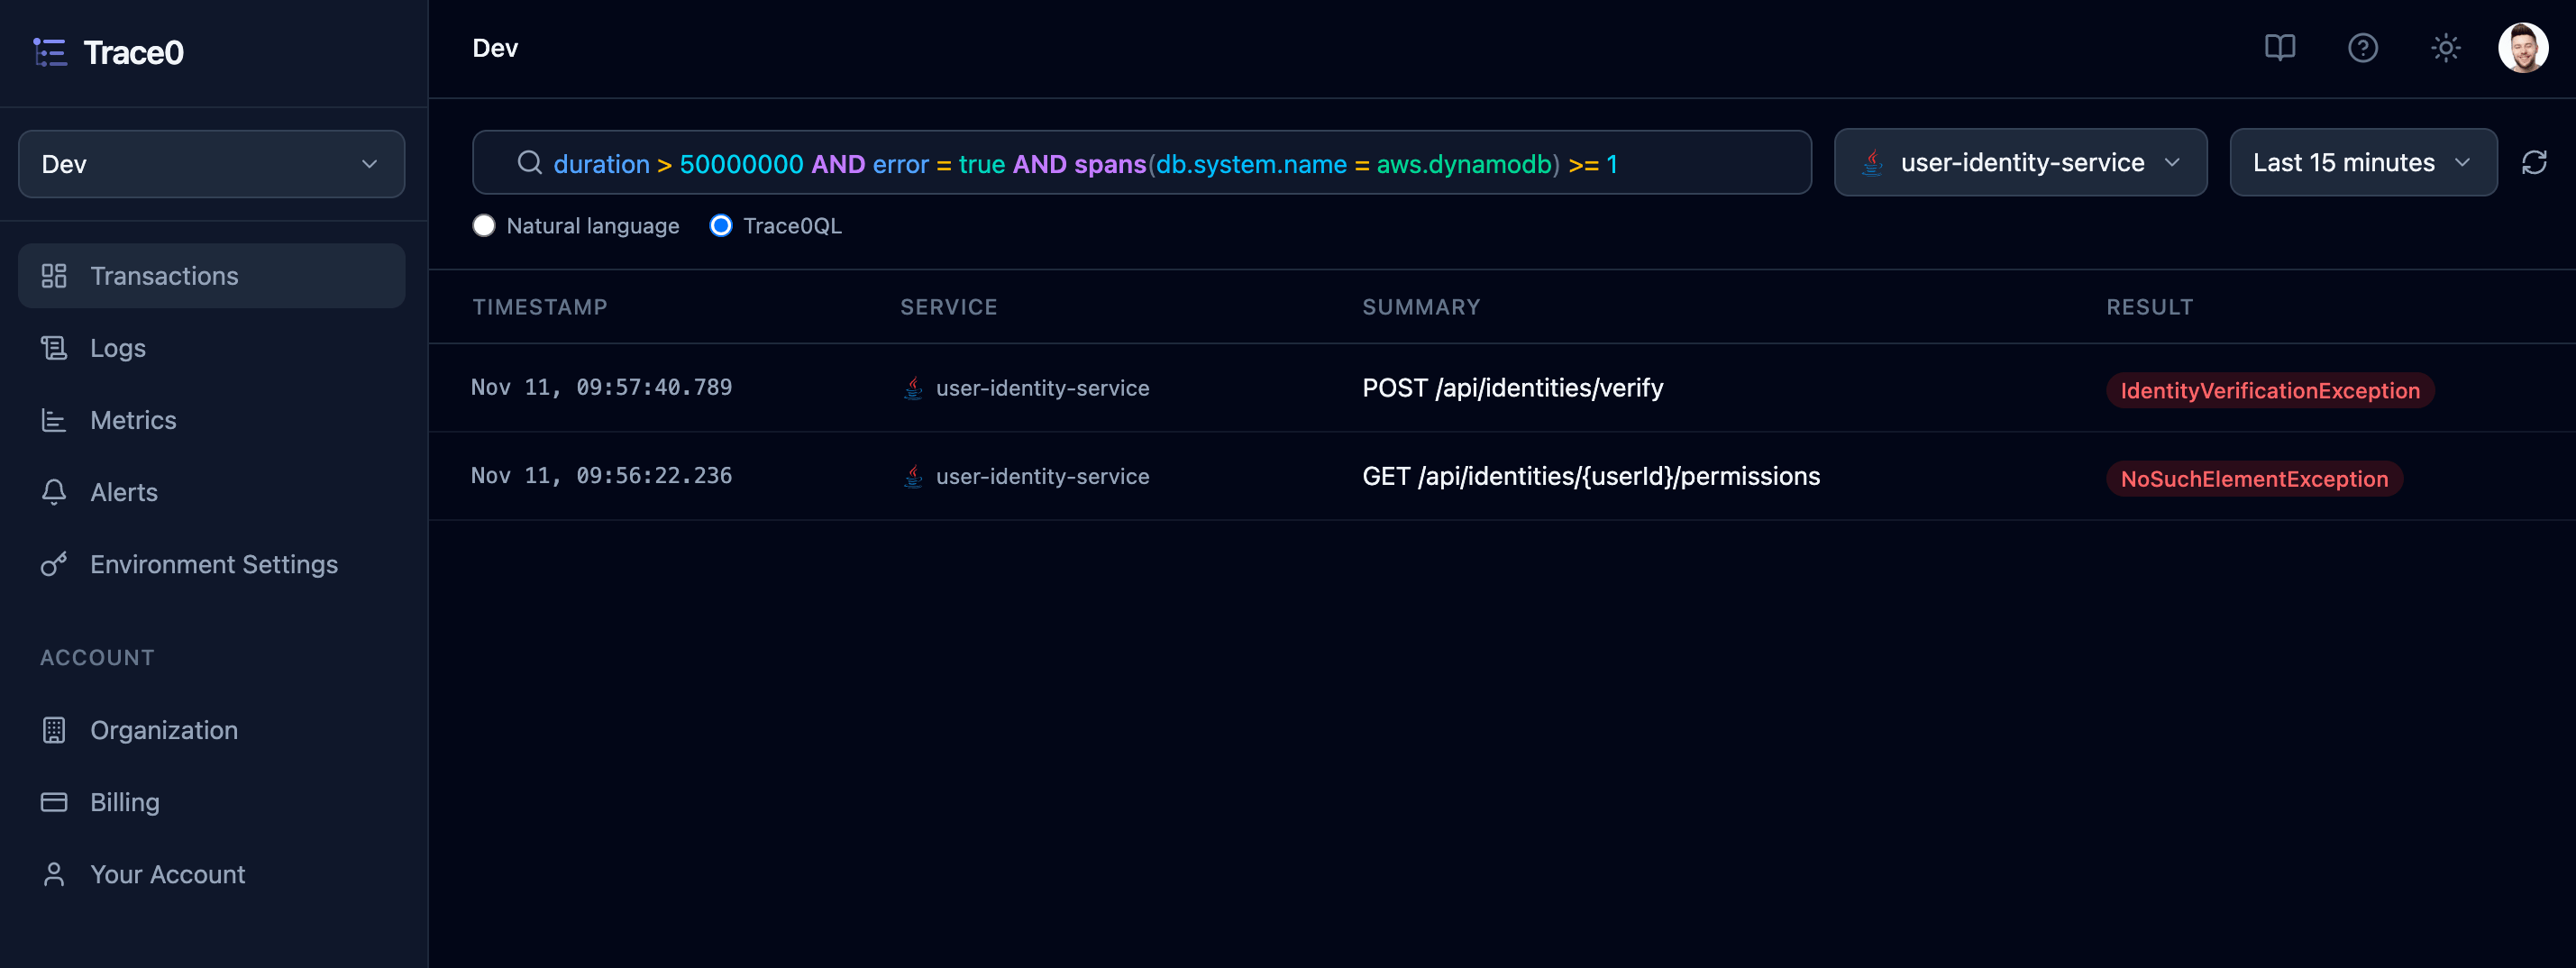
Trace0QL directly in the Trace0QL query box, or describe what you’re looking for in plain English with Natural Language Search, which is converted to Trace0QL for you. Either way, the query that was run is shown in the Trace0QL query box, where you can edit it and run it again.
With one query you can search across everything Trace0 knows about a transaction, such as:
- the request(s) each service handled, e.g. its endpoint, duration and status code
- the calls made, e.g. database queries, cloud service calls and requests to third-party APIs
- the infrastructure it ran on, e.g. the ECS task, Kubernetes pod or region
- the tags your services added, e.g. a user ID
- the logs it wrote
Basics
Conditions
A query is made of conditions, each in the formattribute operator value:
AND and OR. AND takes precedence over OR, as in most programming languages, and brackets can be used to change the order:
AND and OR can be written in upper or lower case. Attribute names are case-sensitive.
Values
Values that contain spaces, brackets, quotes or any of the operator characters= ! < > must be double-quoted. Inside a quoted value, escape a double quote or backslash with a backslash:
api.github.com, aws.dynamodb and ARNs don’t need quotes.
Durations (duration and span.duration) are always in nanoseconds:
Boolean attributes take
true or false, e.g. error = true. Numbers must not contain commas.
Attributes
There are four attribute scopes, which differ in what they match.Trace Record
Trace Record attributes describe the request(s) each service in the transaction handled:Span
Span attributes describe the calls made while handling the request, and match if any span in the transaction matches. They use the OpenTelemetry semantic convention names, e.g.db.system.name, rpc.method, server.address, etc.
span.duration is a derived attribute calculated by Trace0 at ingestion time. It is calculated as follows: span.endTimeUnixNano - span.startTimeUnixNano. The value is always in nanoseconds.
Resource
Resource attributes describe the infrastructure the services ran on, and match if any service in the transaction ran on a matching resource. They use the OpenTelemetry semantic convention names, e.g.cloud.region, cloud.platform, aws.ecs.task.arn, k8s.pod.name, etc.
Tag
Tags are the custom key value pairs your services add, queried astag.<key>, e.g. tag.user_id = 123. A tag condition matches if any service in the transaction has the tag. Tag values are always text.
The query box autocompletes every attribute you can use, including your environment’s tag keys.
When a service is selected, span conditions only match that service’s own spans. Transaction attributes are for that service’s requests, while resource attributes and tags still match any service in the transaction.
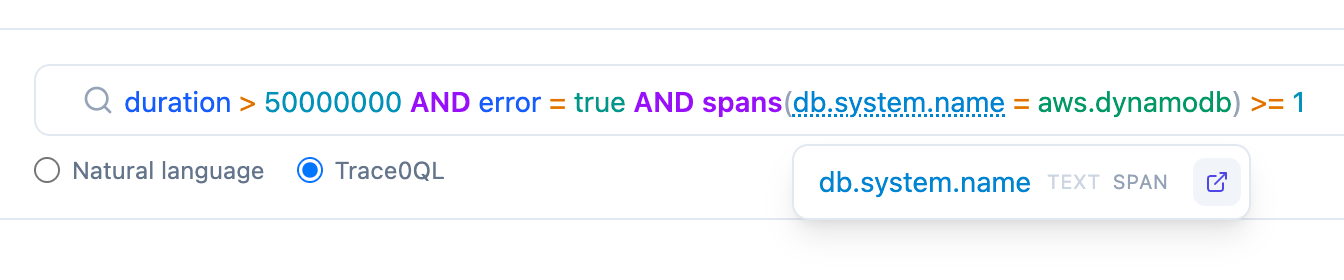
You can hover over any attribute in a Trace0QL query to see its type (e.g. Text), scope (e.g. Span) and a More Details link. For example, the link for the
db.system.name opens its OpenTelemetry semantic convention page.

Logs
Search the logs a transaction wrote withlog contains "<term>":
AND, not used inside brackets, an OR or spans(...).
Matching the same call with spans(…)
A span condition on its own matches if any span in the transaction matches it, so two span conditions joined withAND can be matched by two different spans. This query matches a transaction that made a fast KMS call and a separate slow database call:
spans(...) and compare the number of matching spans with a count:
spans(...) also lets you count calls. Each spans(...) is counted separately, so this finds transactions with two or more KMS calls, at least one of which took longer than 29ms:
spans(...), and it can’t be nested inside another spans(...). The count can be compared with =, !=, >, >=, < or <=, and = 0 finds transactions with no matching calls.
Operators
contains is the best choice when you only know part of a value, e.g. an endpoint without its HTTP method: endpoint contains /assessment.cancel.