
How are Metrics Calculated?
In Trace0, JavaScript metrics come from the following two OpenTelemetry sources:- Requests metrics are calculated from the service’s
SPAN_KIND_SERVERspans, one per request the service handles. Request count, requests per second, latency percentiles and errors are all derived from these spans and their durations and statuses. - JavaScript runtime metrics (Memory, Garbage Collection, Resources and Event Loop) are calculated from the OpenTelemetry metrics the JavaScript runtime reports, as defined by the OpenTelemetry semantic conventions for V8 JS metrics and the OpenTelemetry semantic conventions for Node.js metrics.
Service Instances
JavaScript runtime metrics are reported separately by each instance of your service, so we show them for one instance at a time. Requests metrics are calculated from spans and cover all instances. We identify an instance using one of the following OpenTelemetry resource attributes, in order of preference:
Select an instance from the instance filter to view its JavaScript runtime metrics. If your service doesn’t report any of these attributes, JavaScript runtime metrics are not shown.
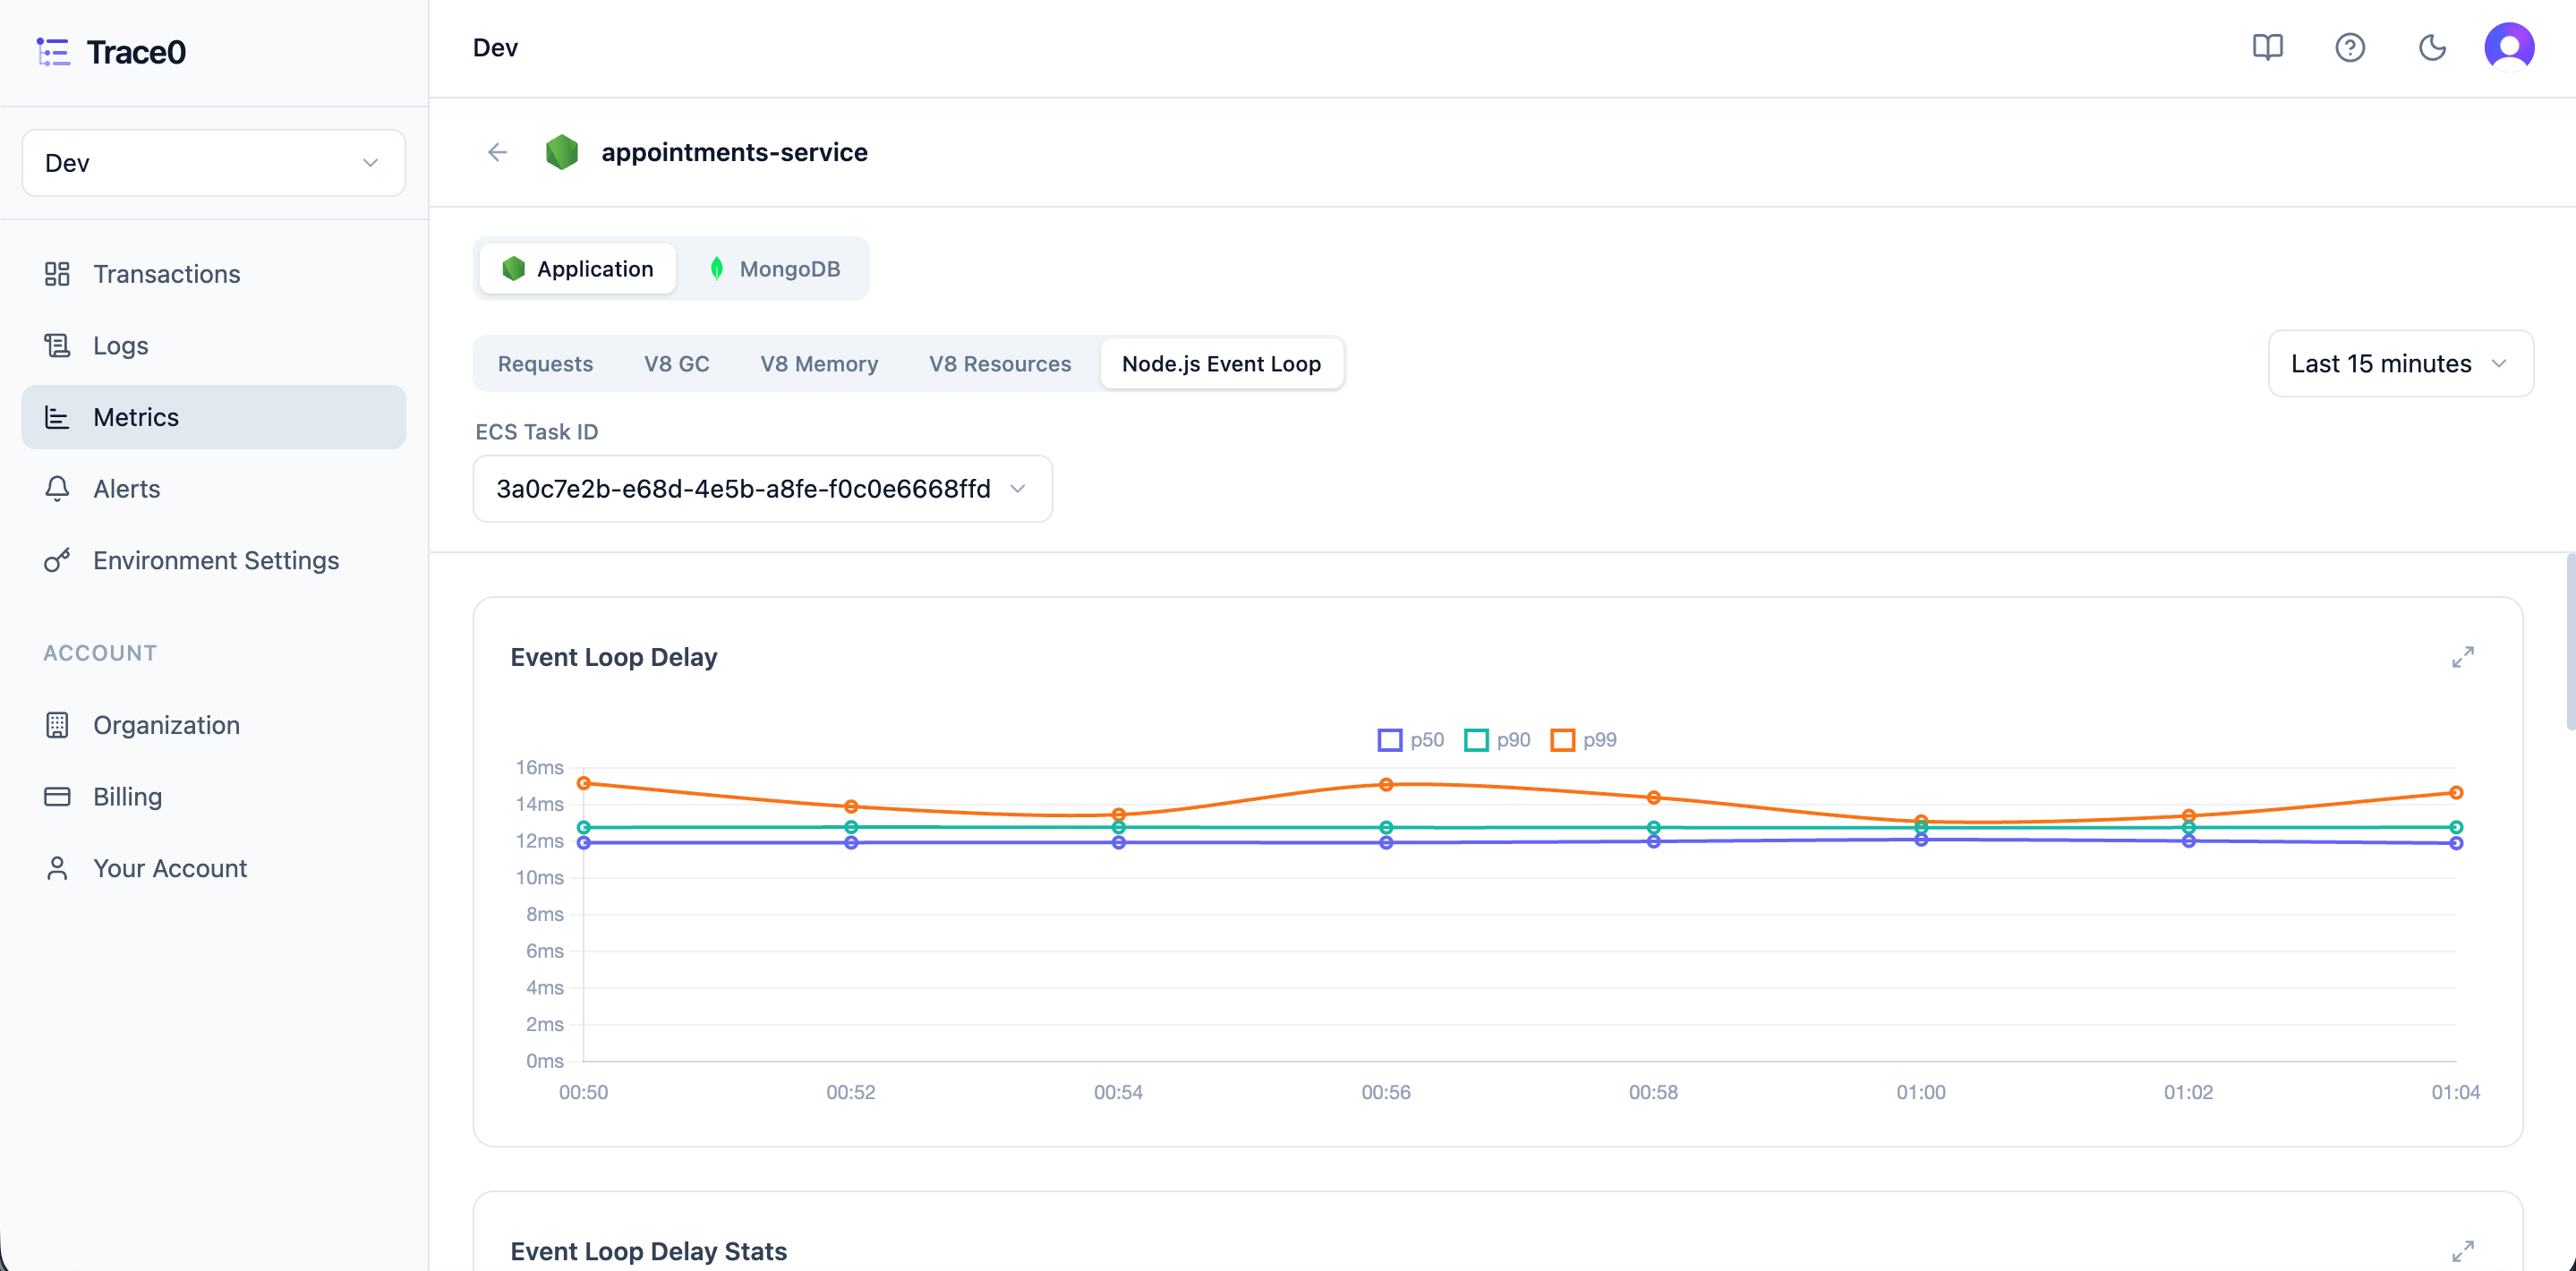
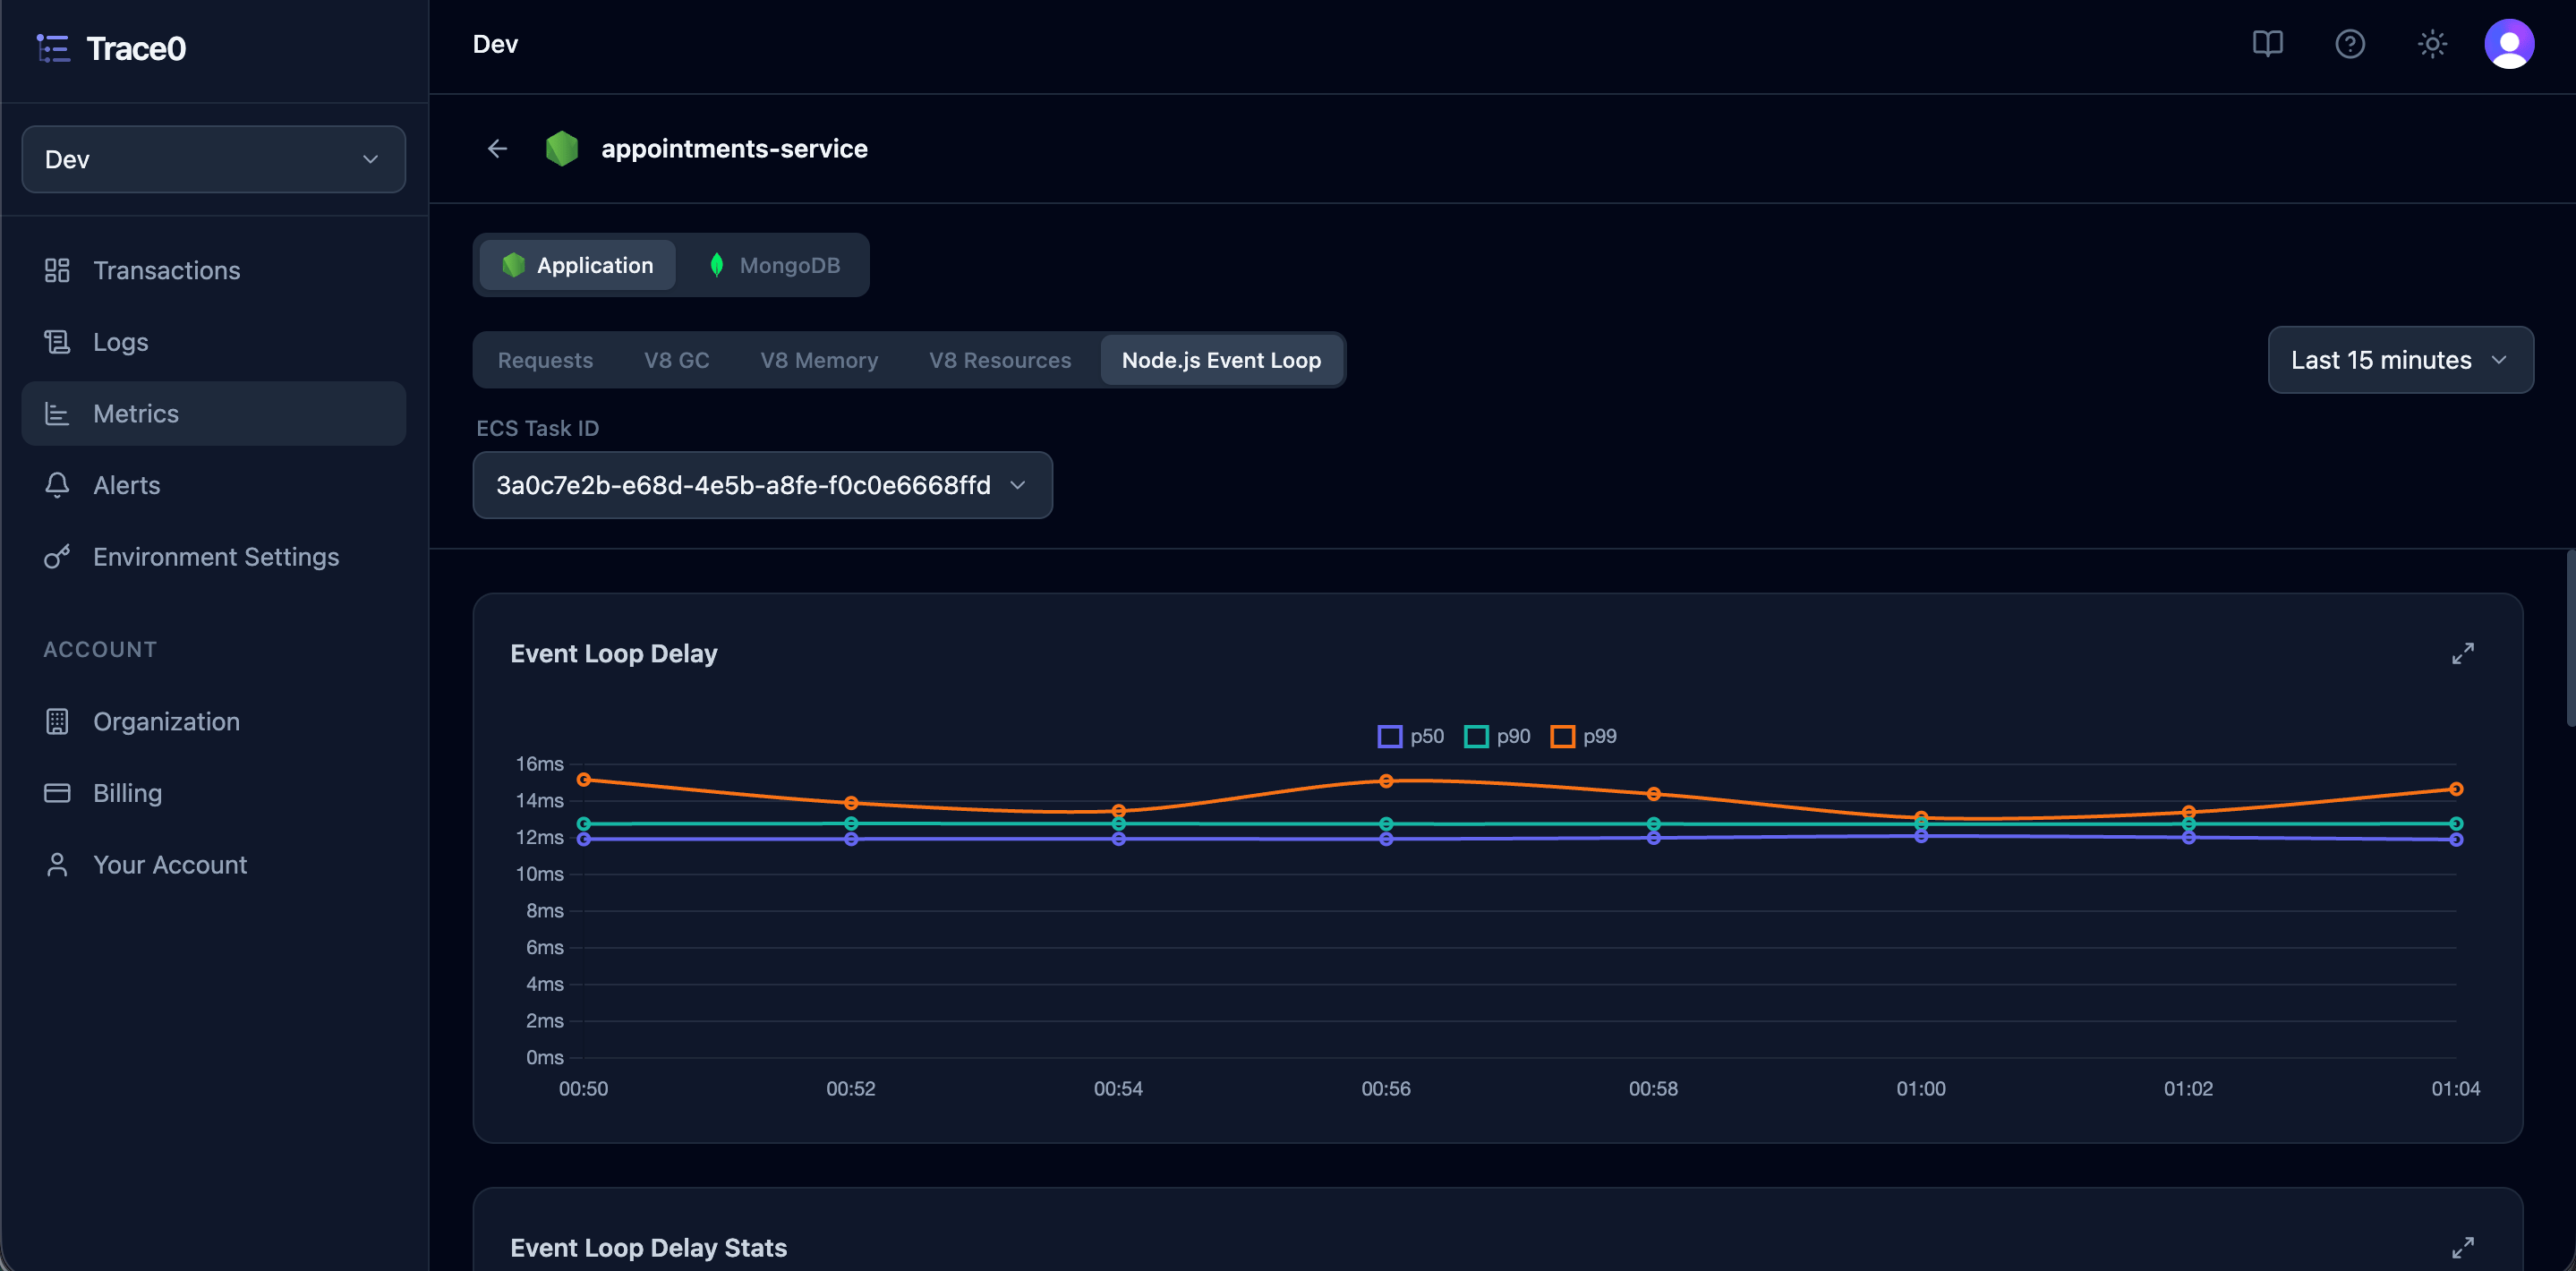
JavaScript runtime metrics aren’t shown for serverless runtimes (e.g.
AWS Lambda), as each execution environment is short-lived and its runtime metrics aren’t meaningful on their own. Serverless-specific metrics (e.g. cold starts) are coming soon.Aggregation Temporality
OpenTelemetry Sum metrics (Counters and UpDownCounters) and Histogram metrics are reported with an aggregation temporality, which decides what each reported data point means. We use the most recent aggregation temporality the service reported for the metric in the selected period. An aggregation temporality can either beCumulative or Delta.
Gauge and Summary metrics don’t have an aggregation temporality, so this doesn’t apply to them.
Metrics
We currently display the following application metrics for services running on JavaScript runtimes that use the V8 engine (e.g. Node.js):Requests
Single Value
Chart