 You can then click the
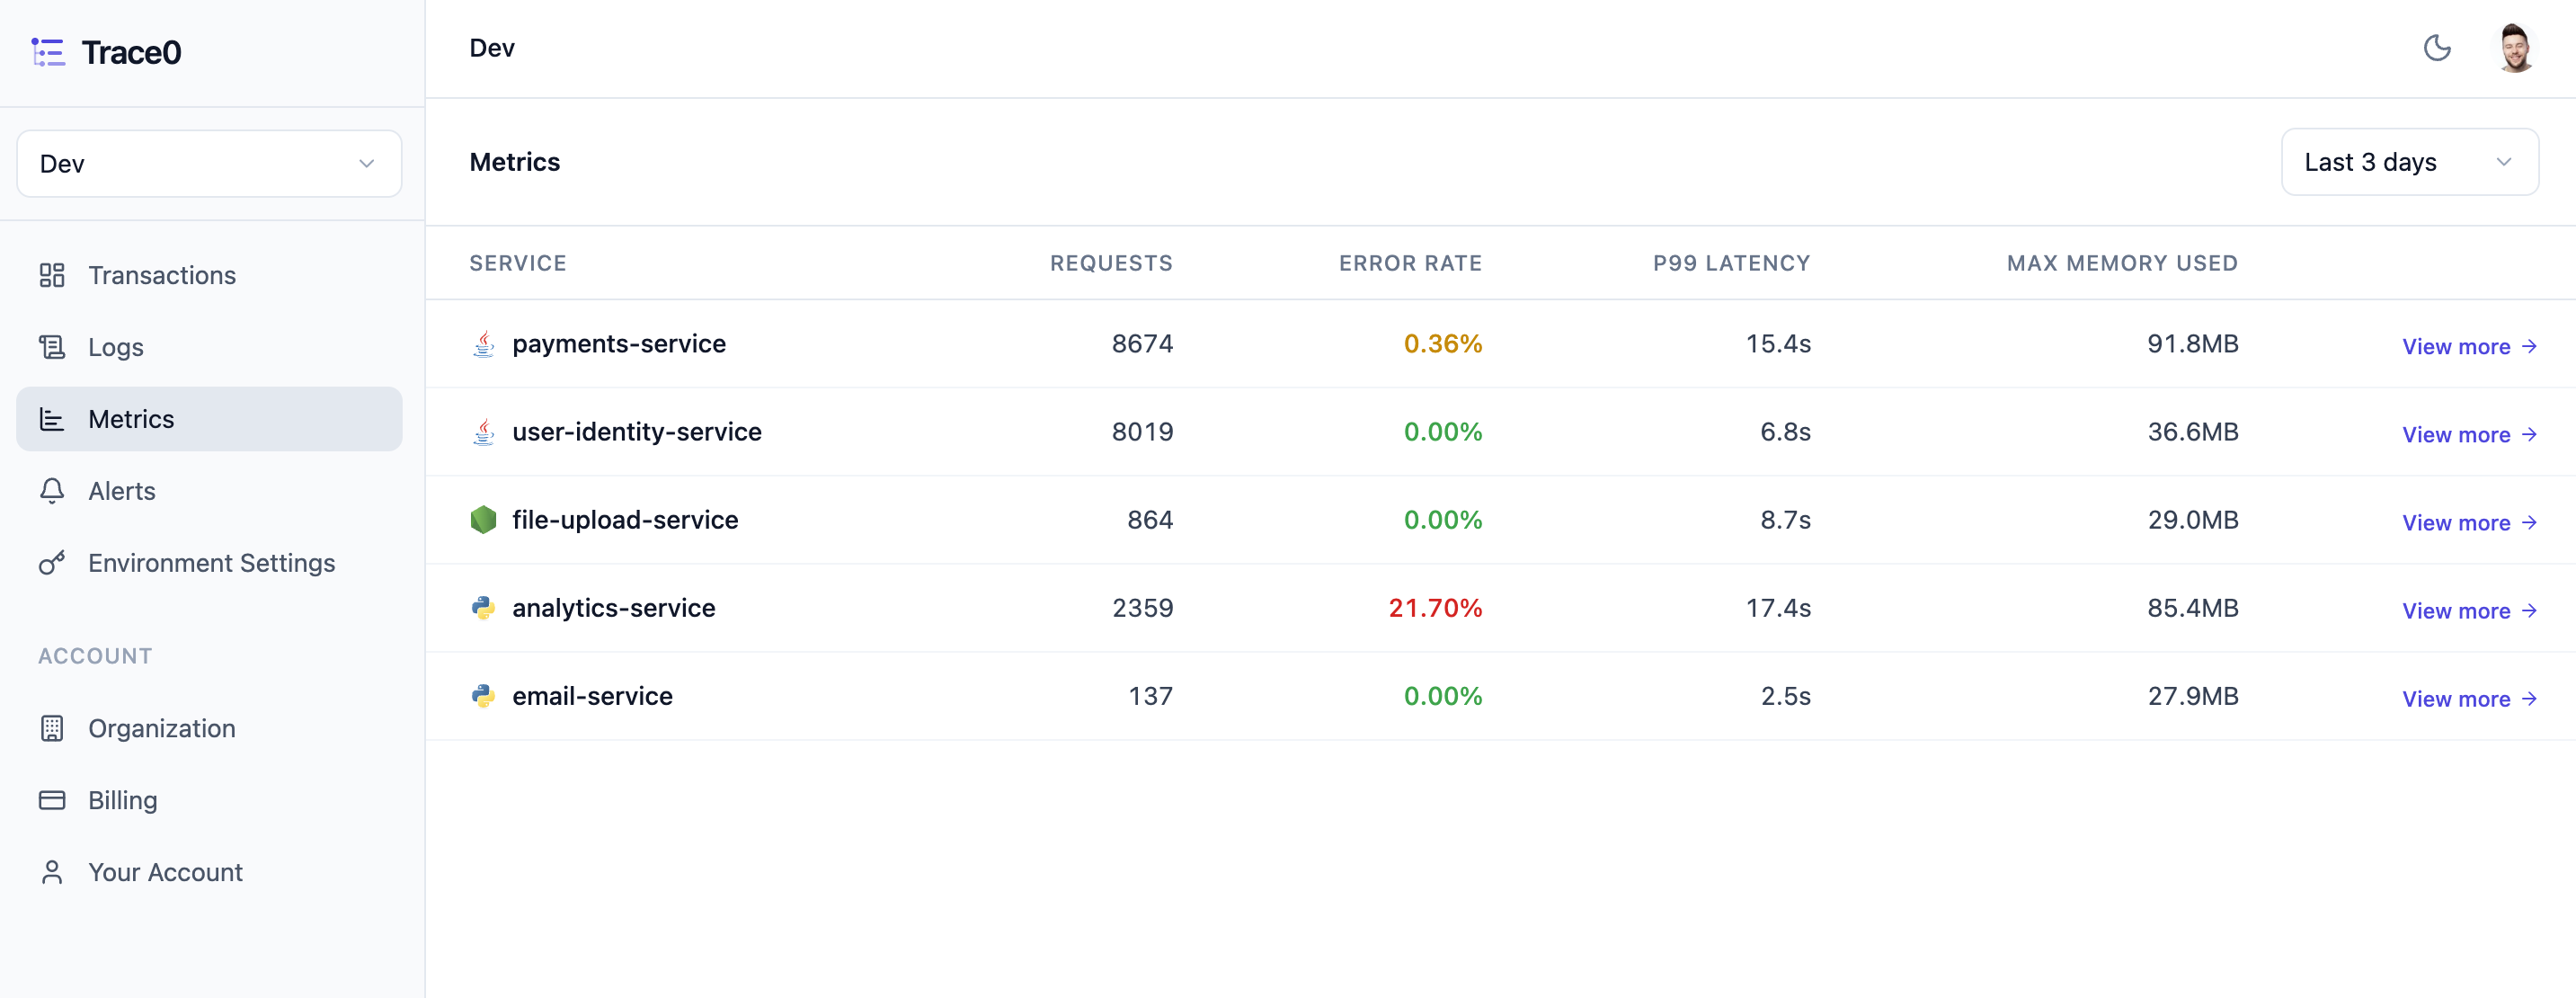
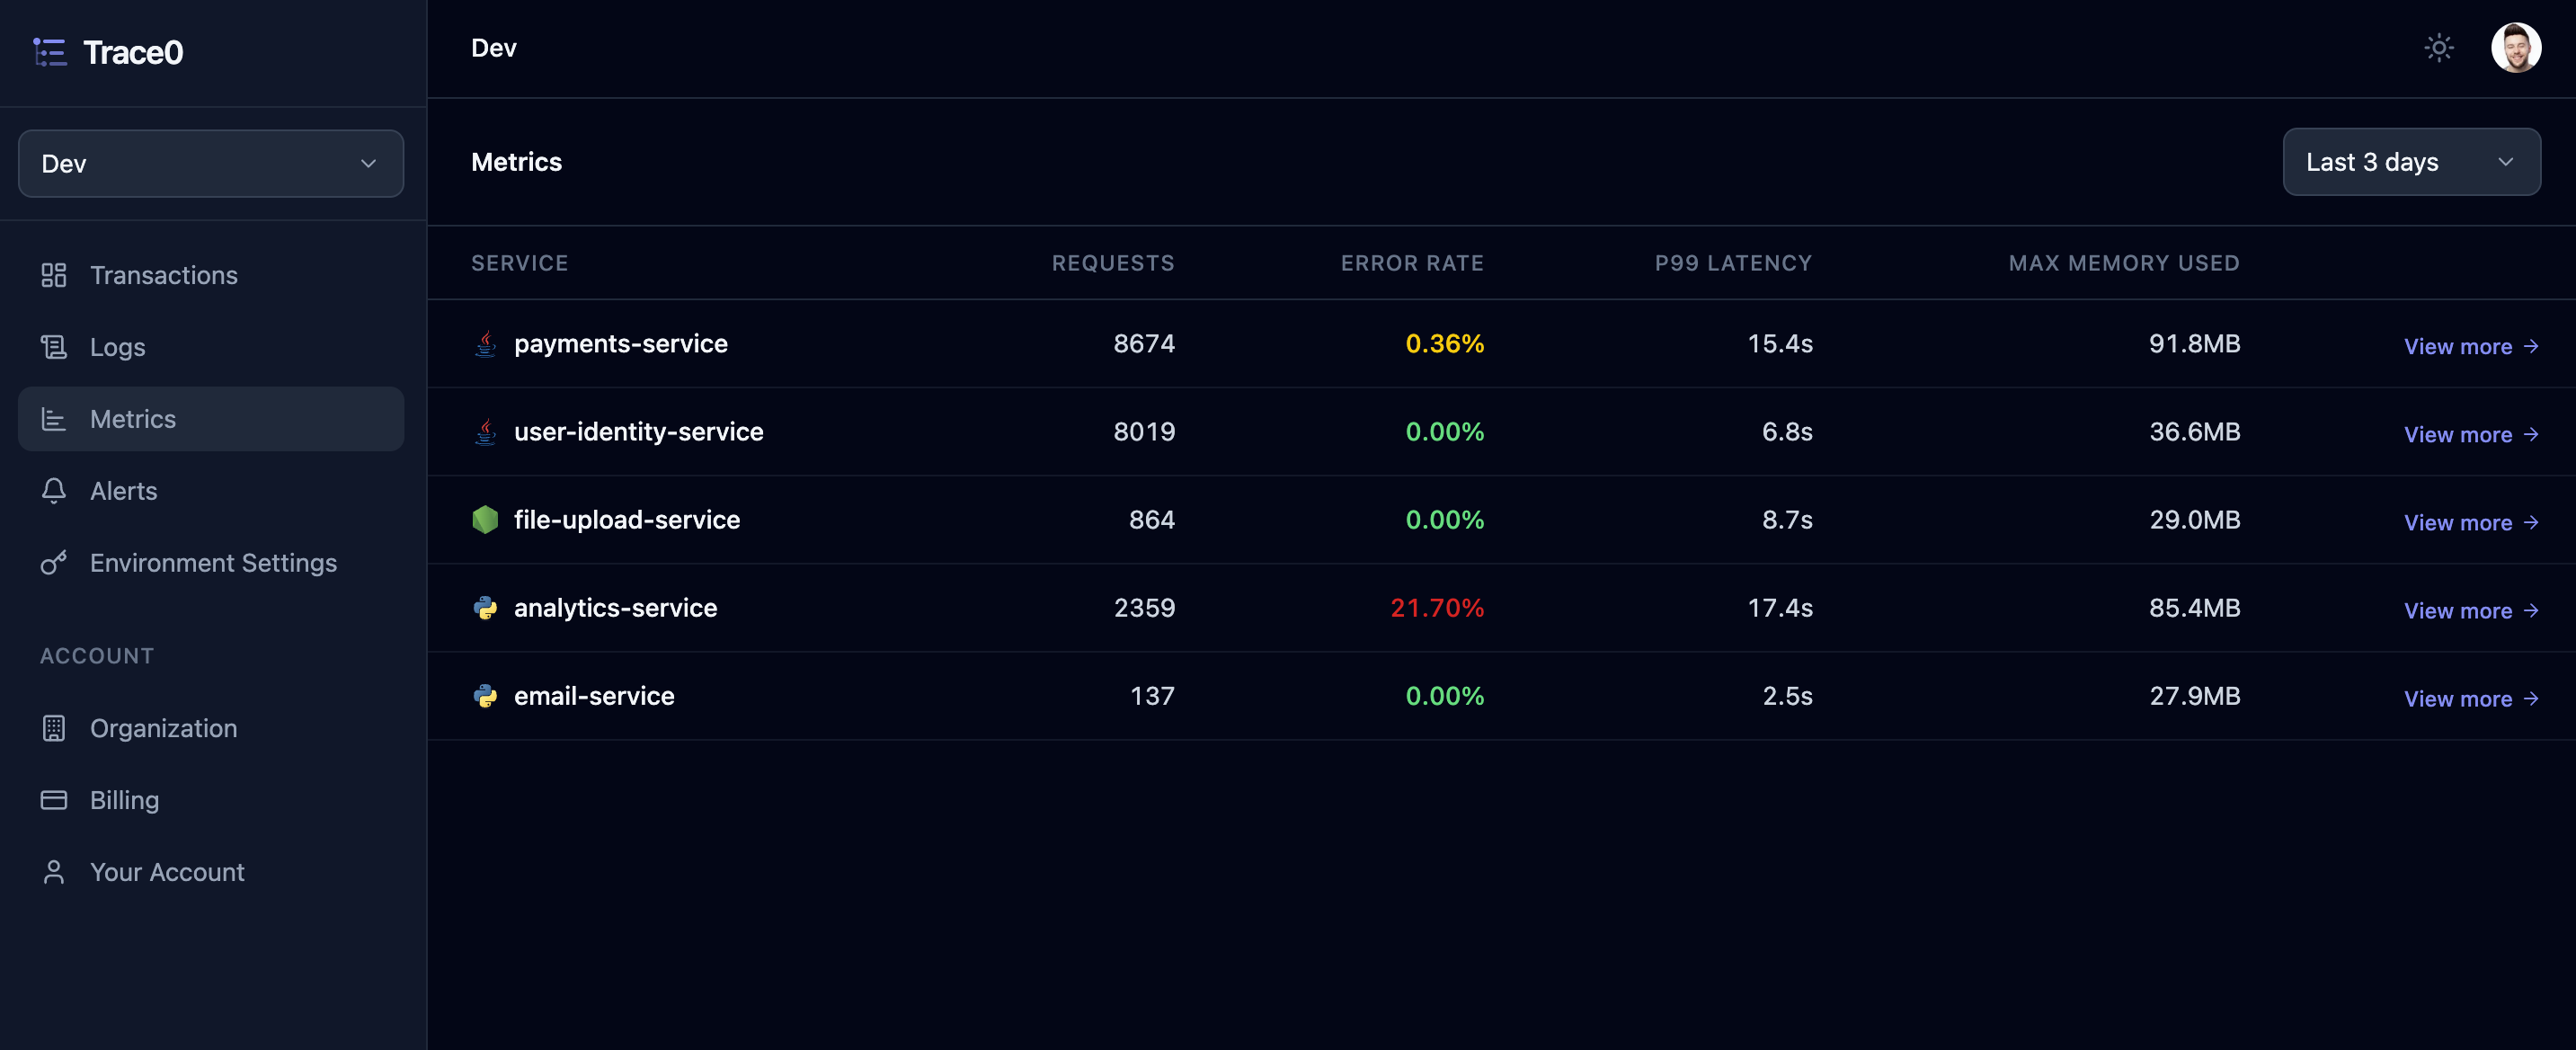
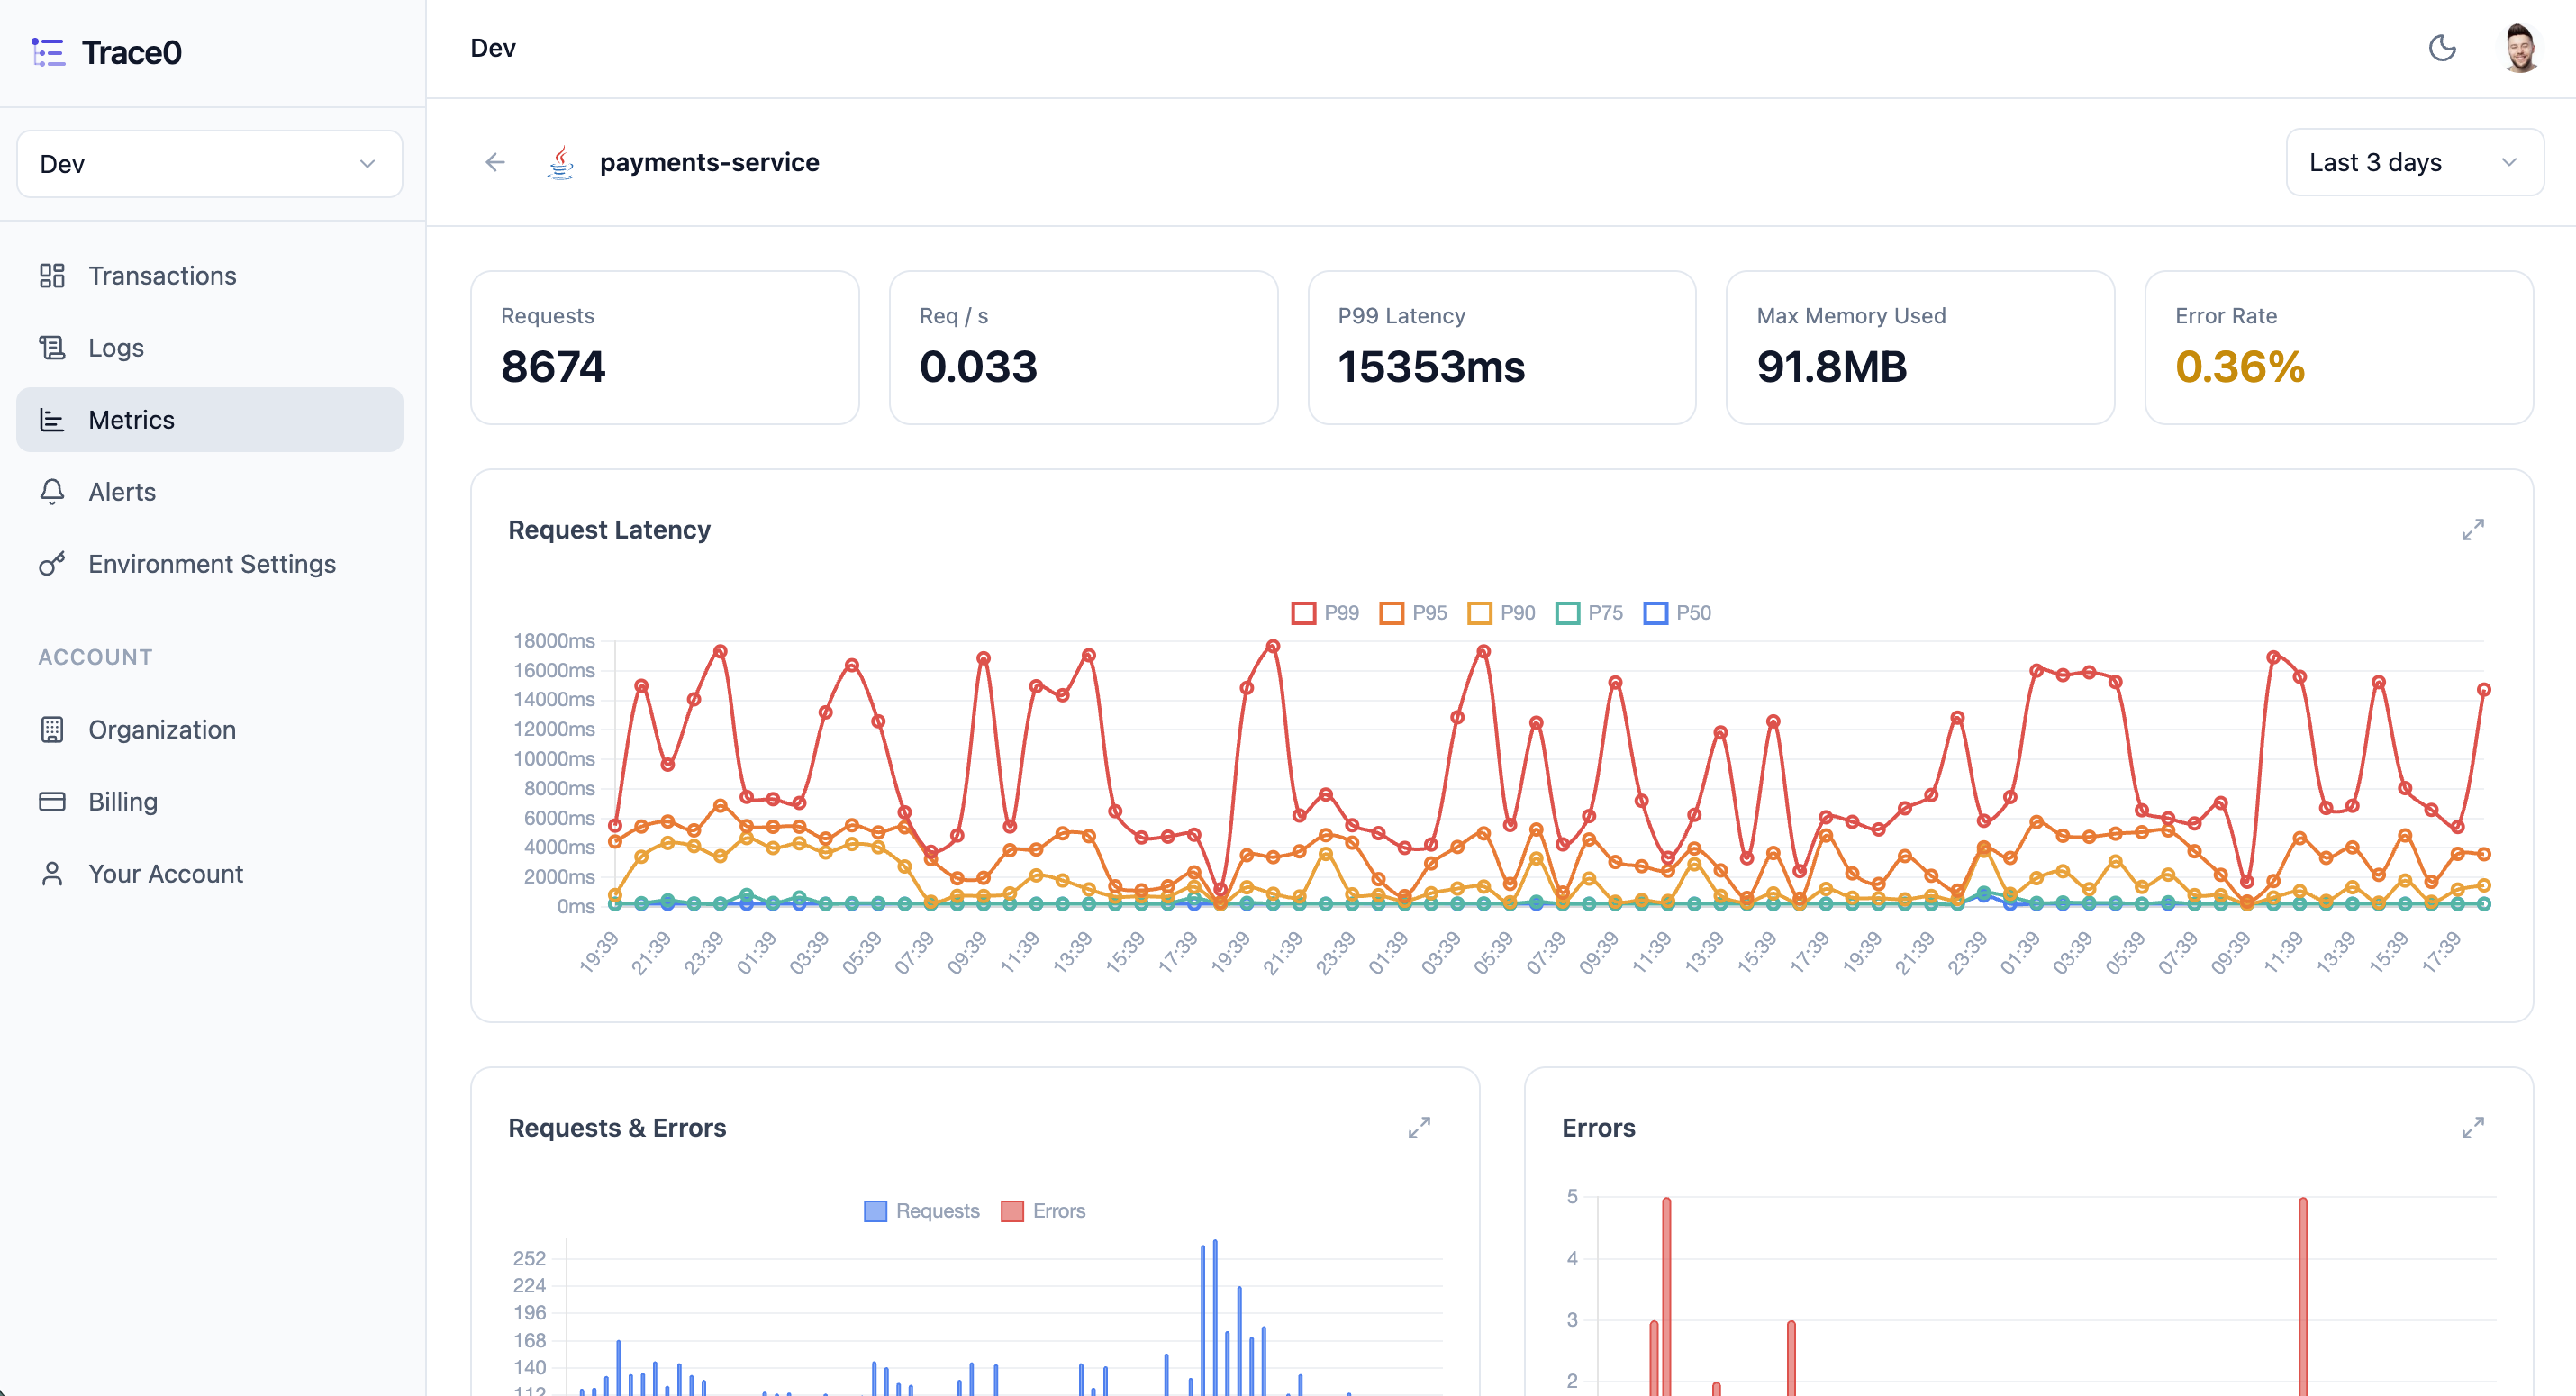
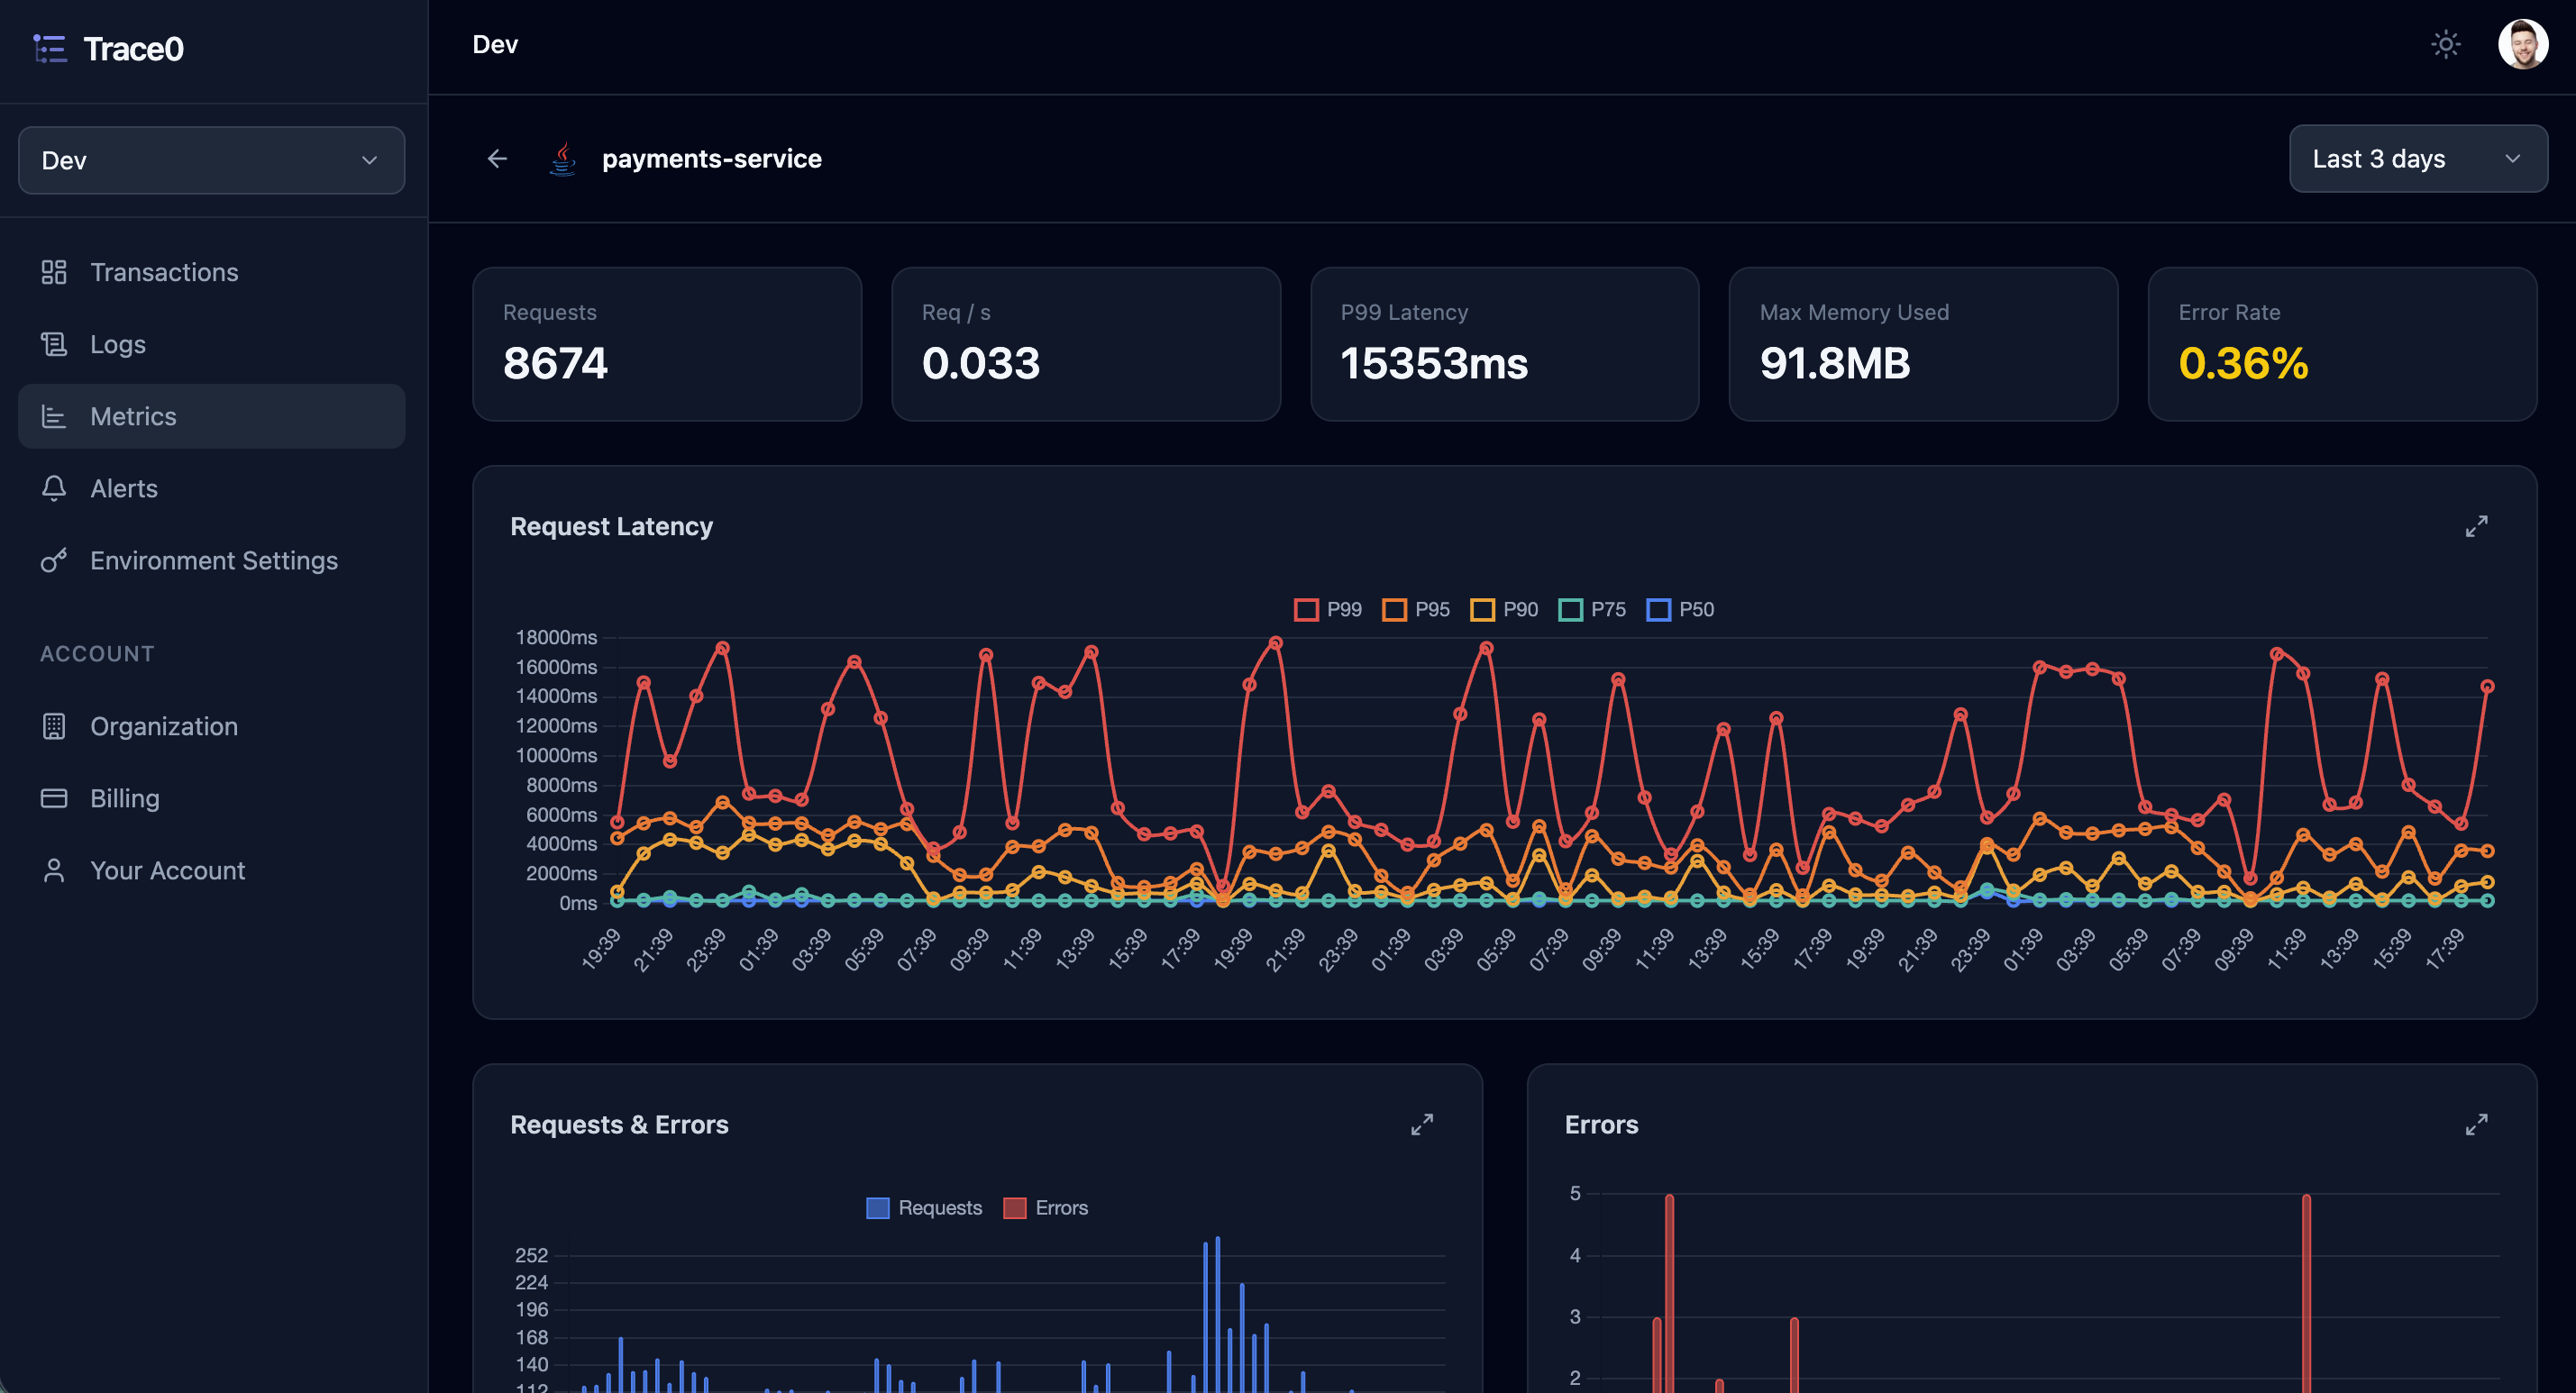
 View more link for any service to view detailed metrics and dashboards for that service:
Displayed Metrics
We currently display the following metrics for each language/runtime. Metrics are displayed either as a single value or as a chart.- Java
- JavaScript / Node.js
- Python
Single Value
Chart
| Metric | Unit |
|---|---|
| Request Count | Number |
| Requests per Second | Number |
| Request Latency P99 | Time (ms, s) |
| Error Rate | Percentage |
| Max Memory Used | Bytes (KB, MB, GB) |
| Metric | Description |
|---|---|
| Request Latency P99, P95, P90, P75, P50 | Latency percentile distribution |
| Requests & Errors | Request volume vs error volume |
| Errors | Error volume over time |
| Max Memory Used | Memory usage over time |
| Platform Thread Count | Number of JVM platform (OS) threads in use over time. Does not include virtual threads. |