> ## Documentation Index
> Fetch the complete documentation index at: https://docs.trace0hq.com/llms.txt
> Use this file to discover all available pages before exploring further.
# Transactions
> View and explore distributed traces across your services.
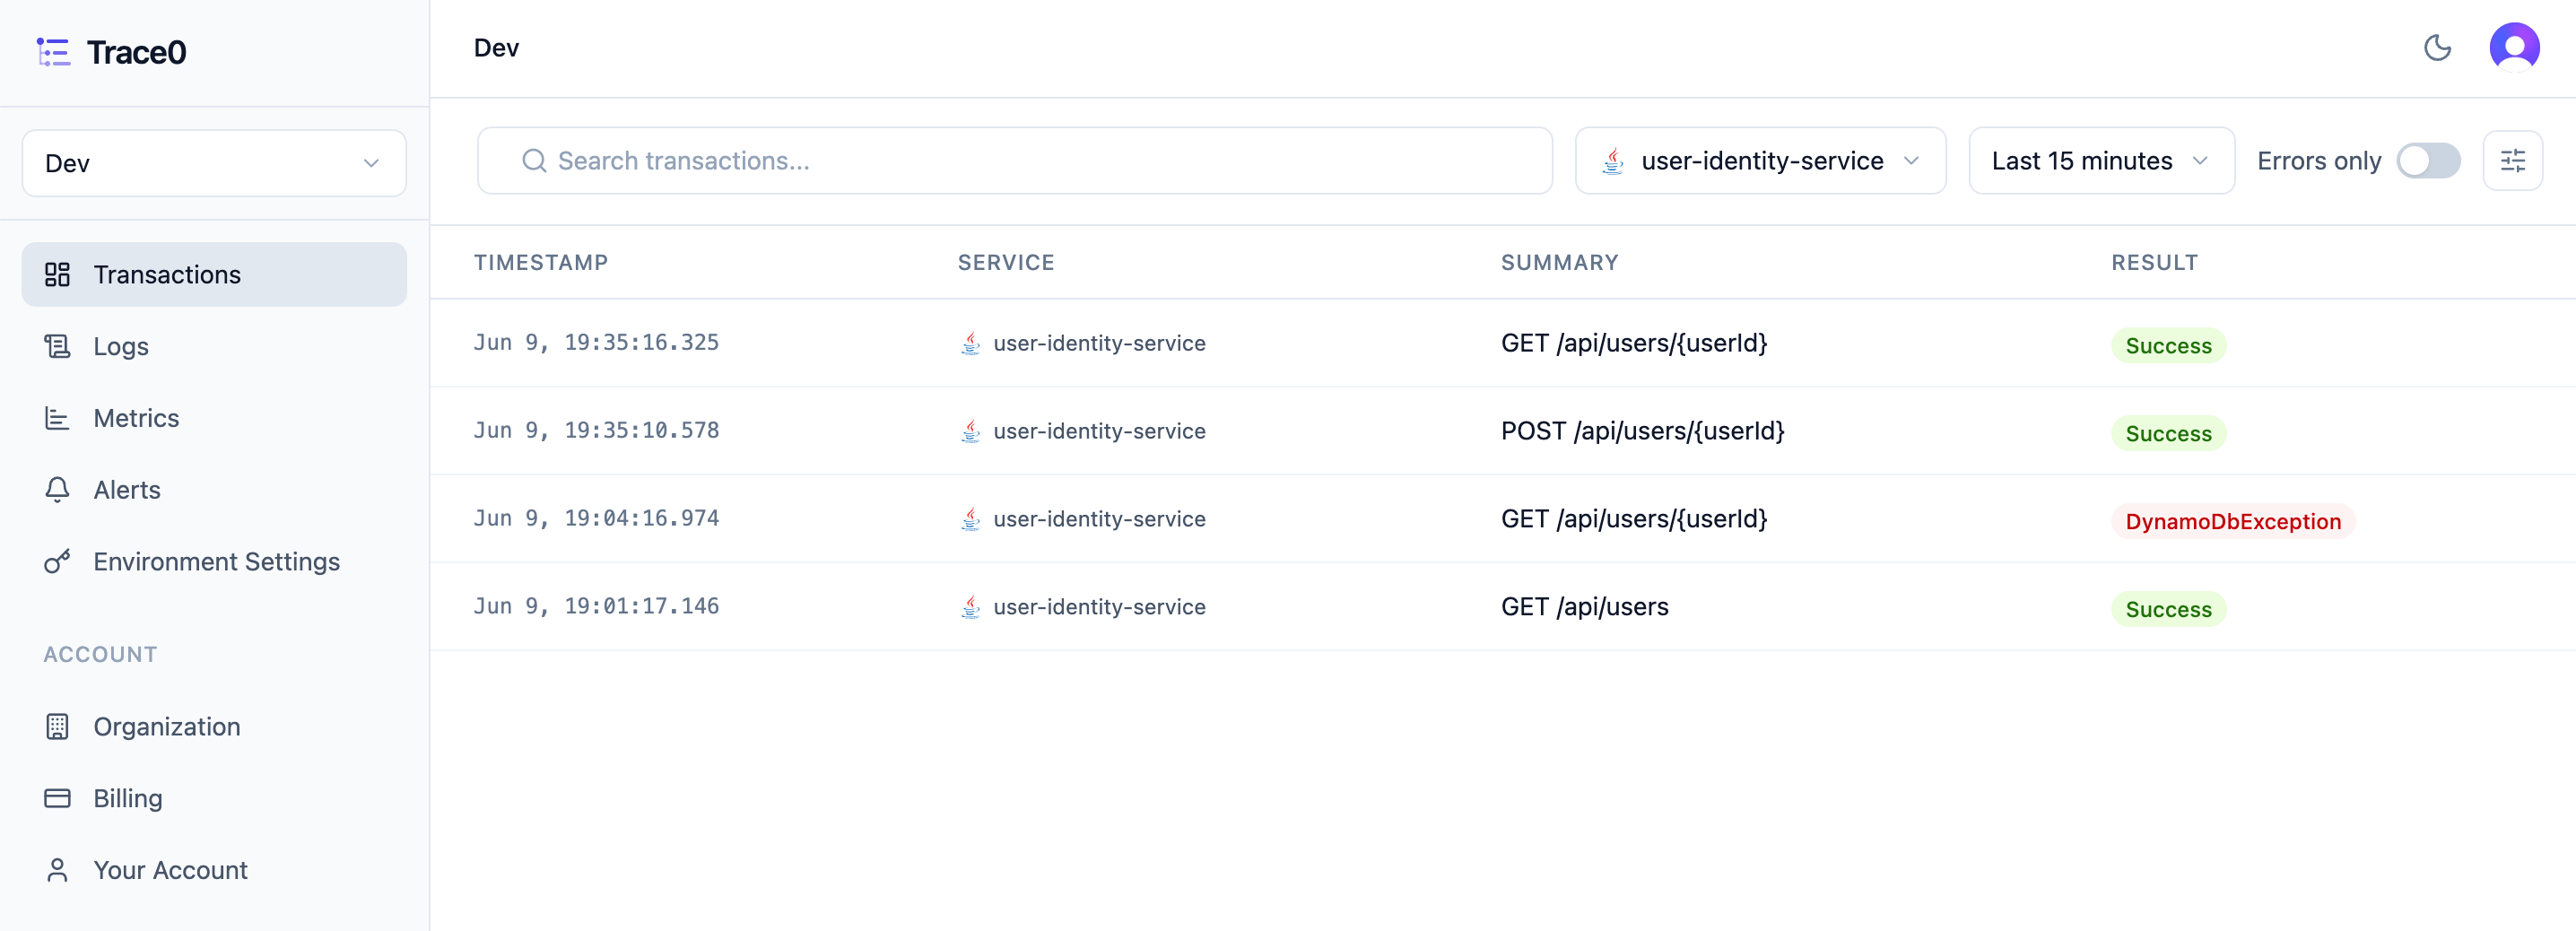
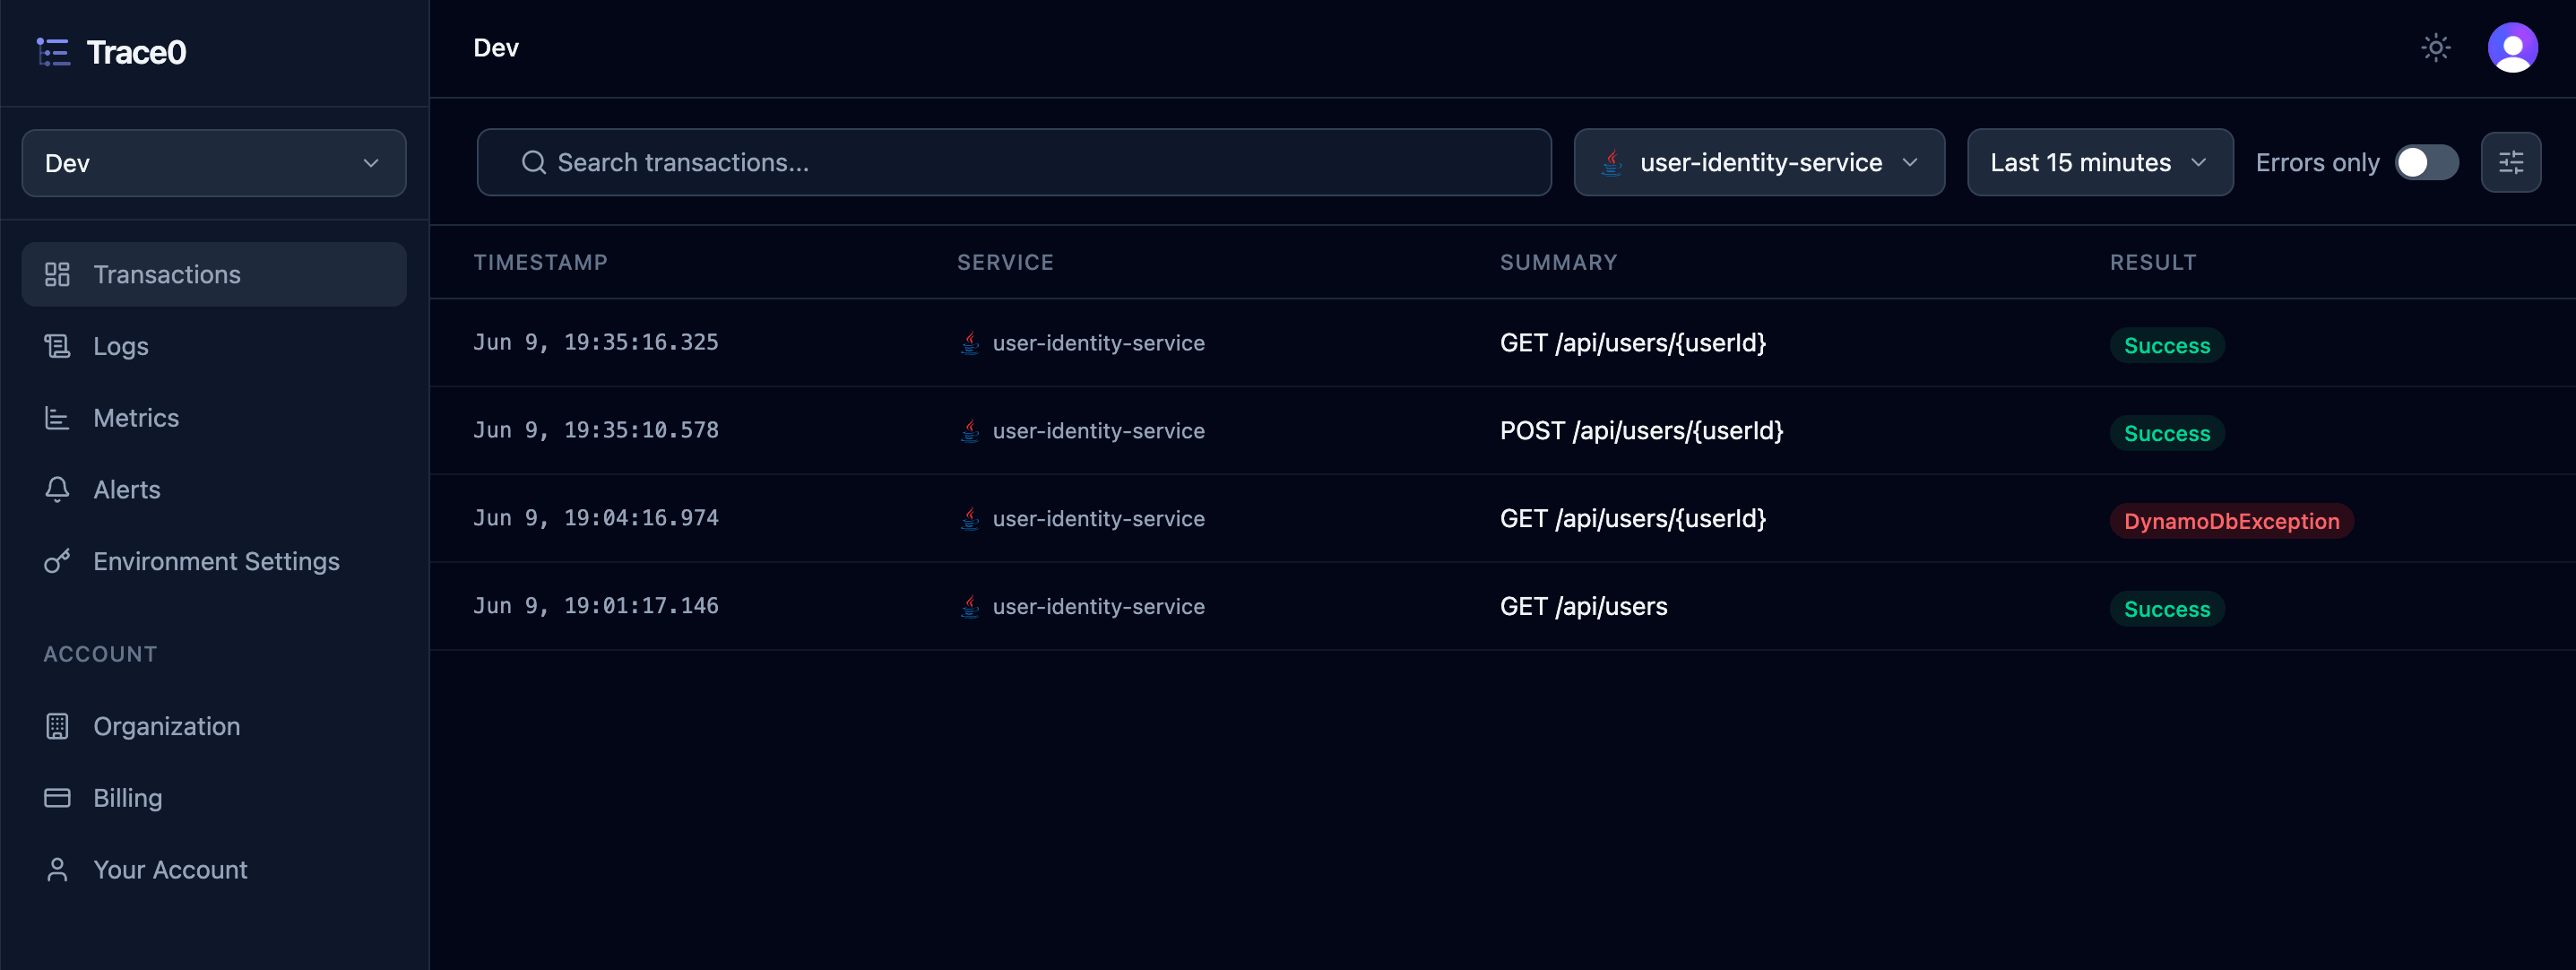
In Trace0, a `Transaction` represents a single end-to-end trace across all services involved in handling a request — such as an inbound HTTP request, a message consumed from a queue, etc.
You can view the list of transactions for each of your services in the [Transactions](https://app.trace0hq.com/transactions) section:
 ### Filtering and Searching
You can filter transactions by service, time period, or using the **Errors only** toggle.
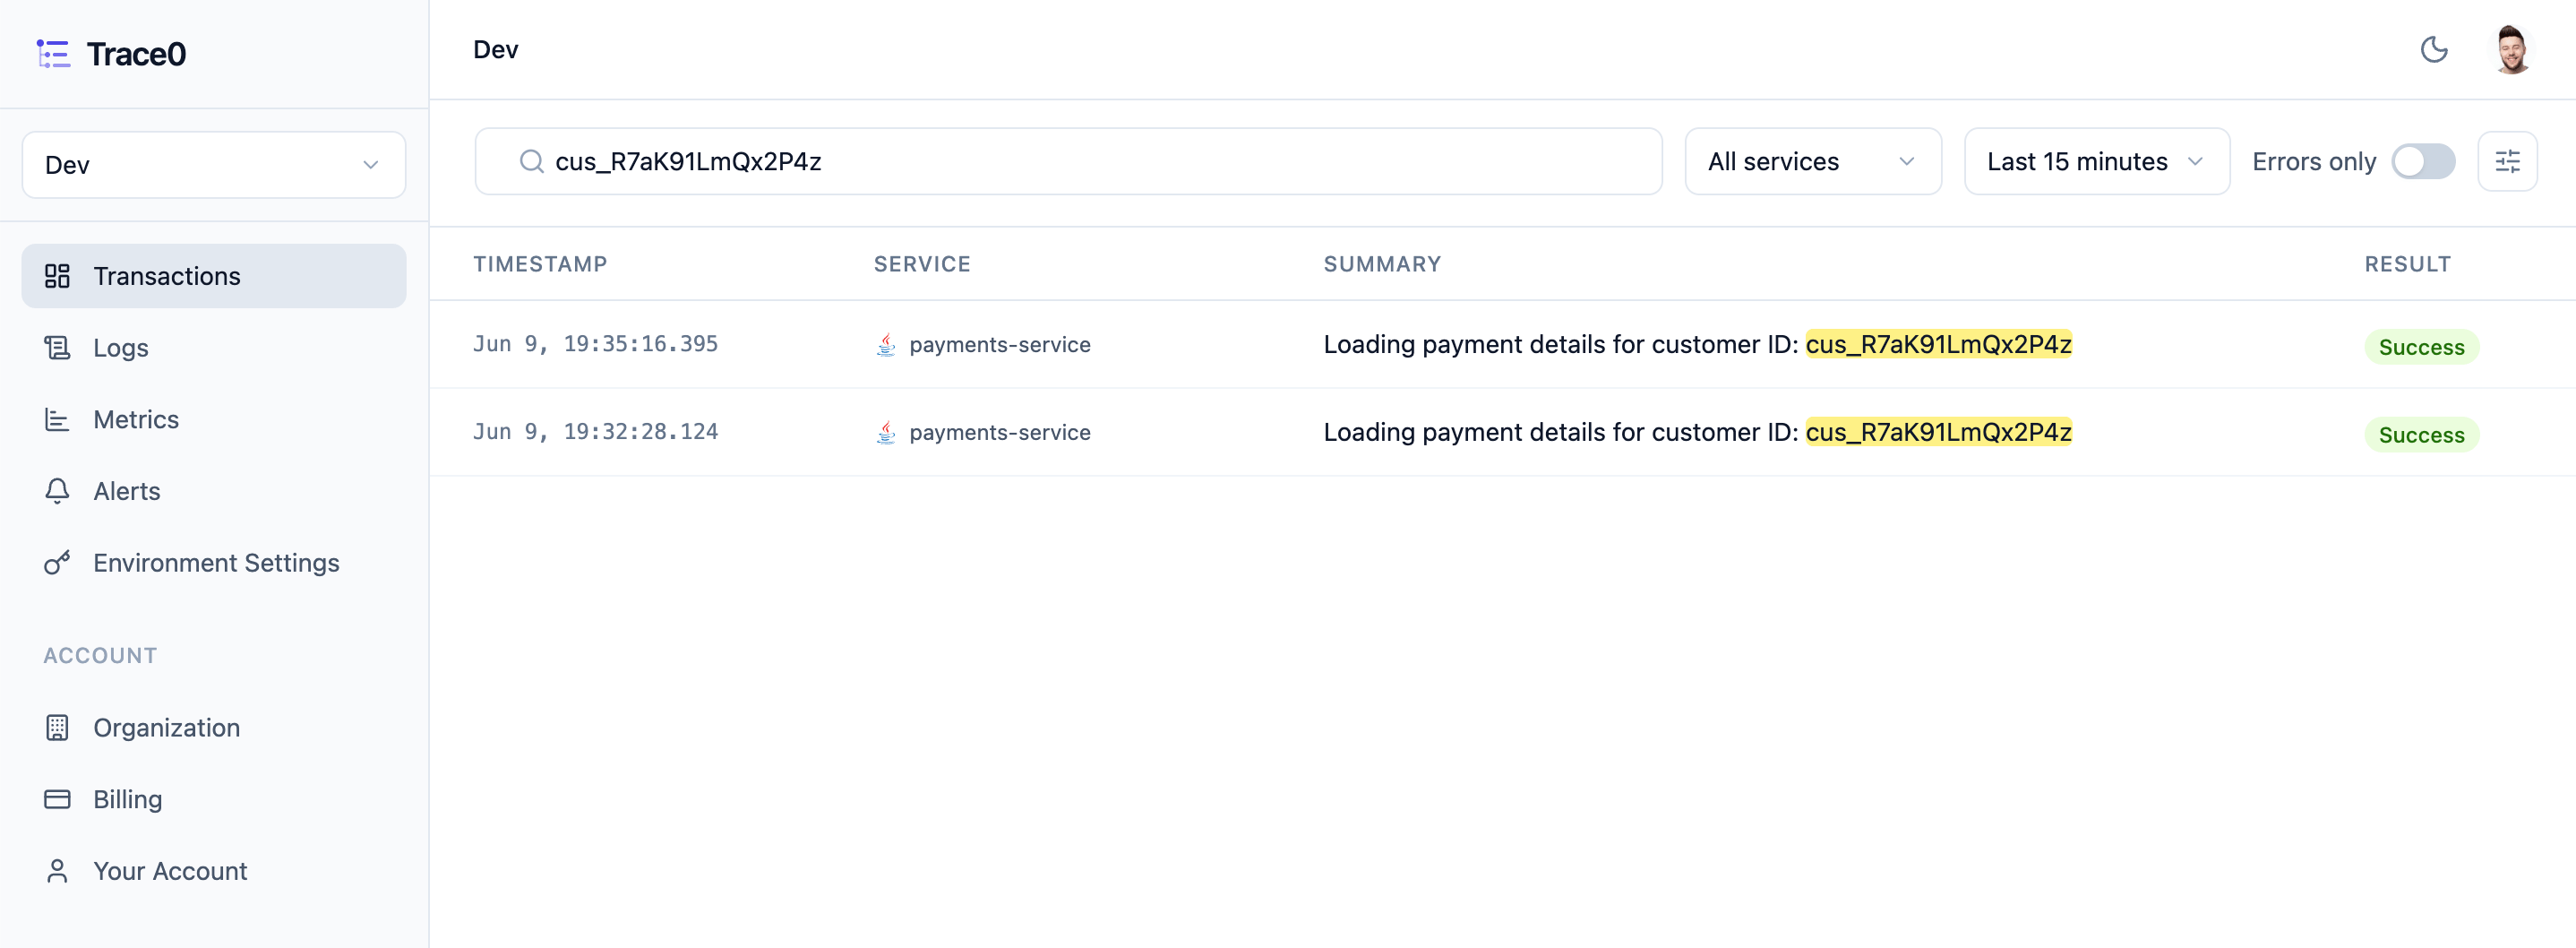
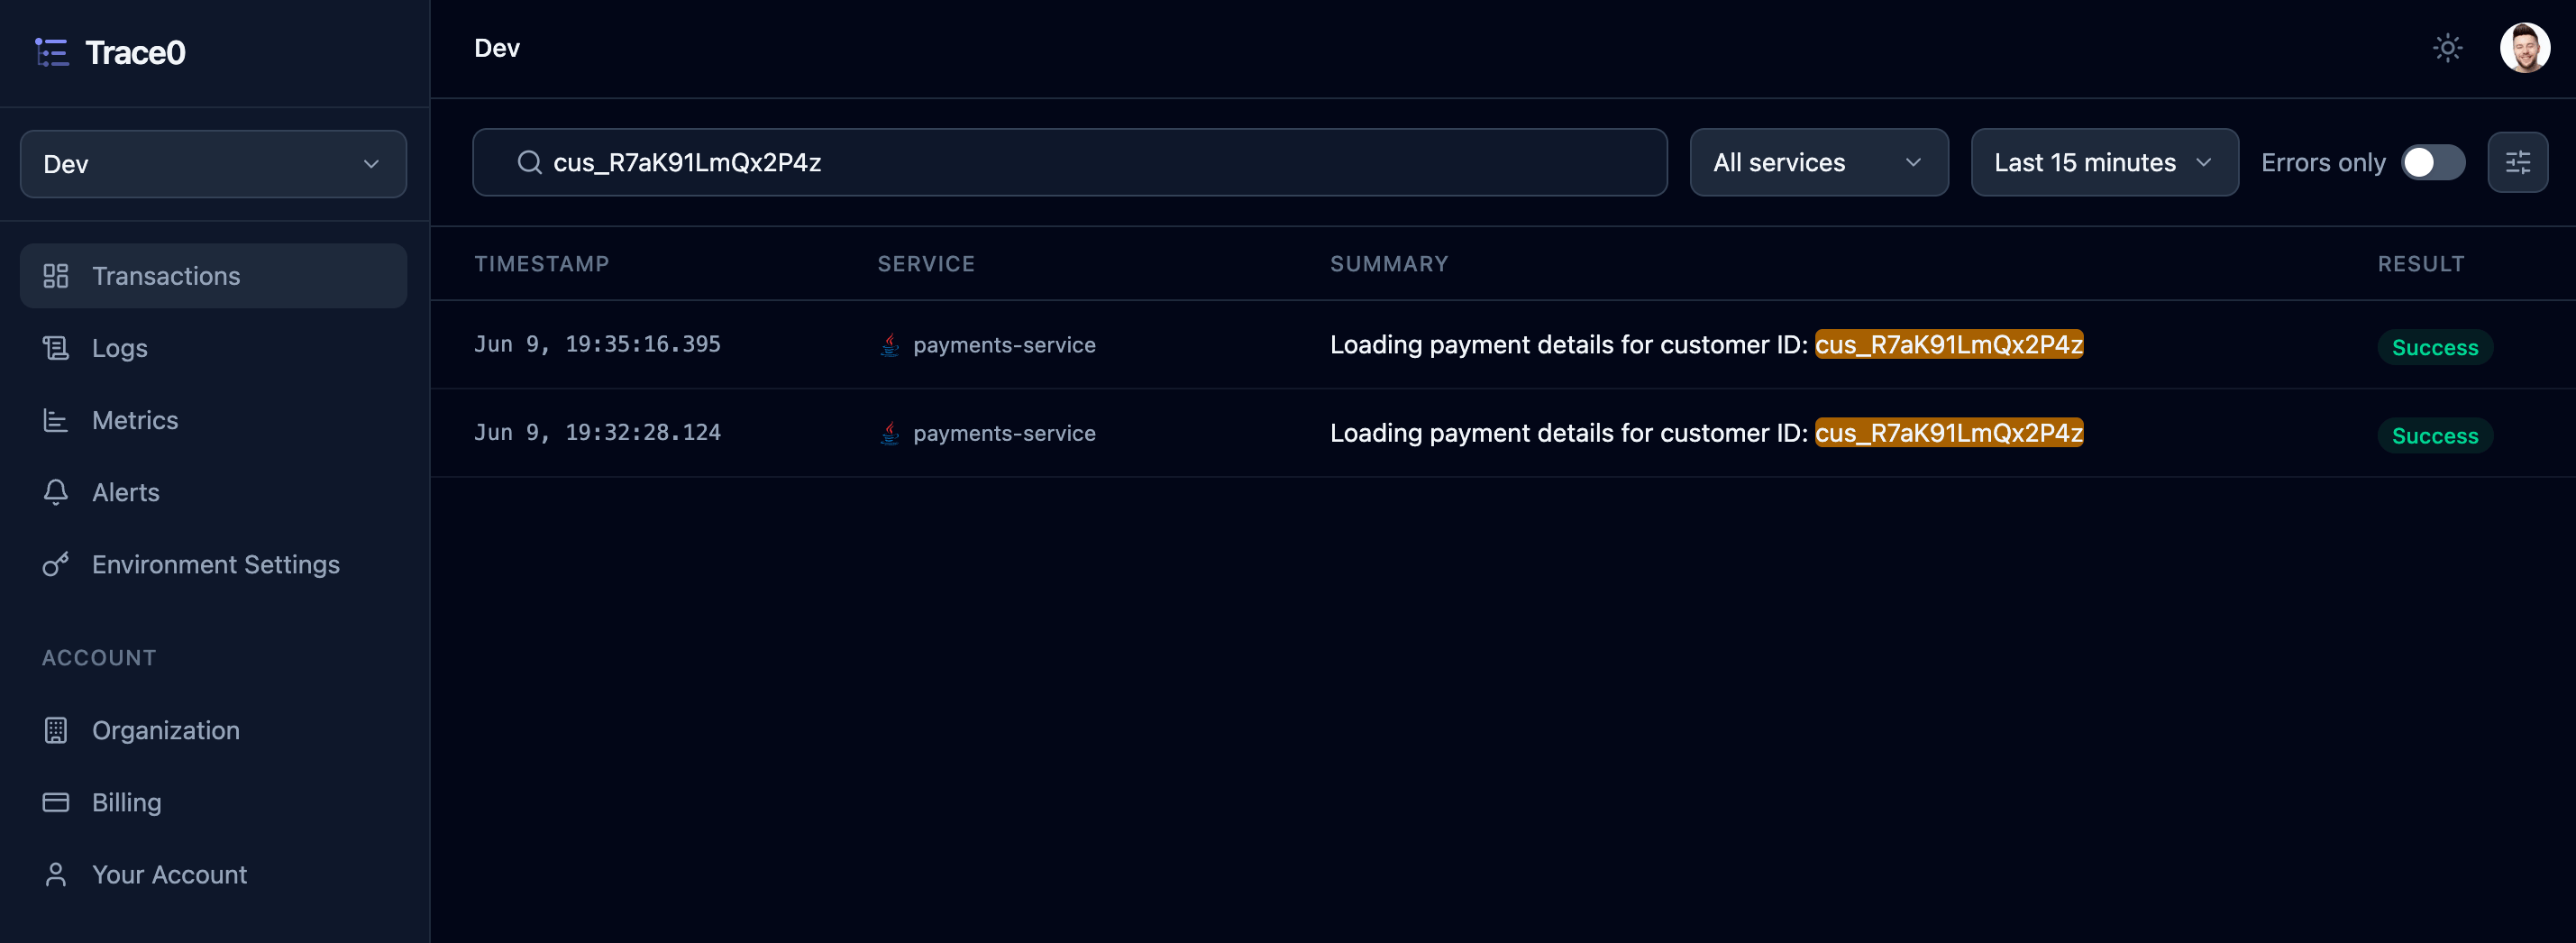
You can also search transactions by free text, returning any transactions where the search term appears in the transaction's log entries:
### Filtering and Searching
You can filter transactions by service, time period, or using the **Errors only** toggle.
You can also search transactions by free text, returning any transactions where the search term appears in the transaction's log entries:
 Additional filters are available by clicking the Filter icon in the top-right corner of the Transactions screen. This opens a pop-up modal containing all available filters:
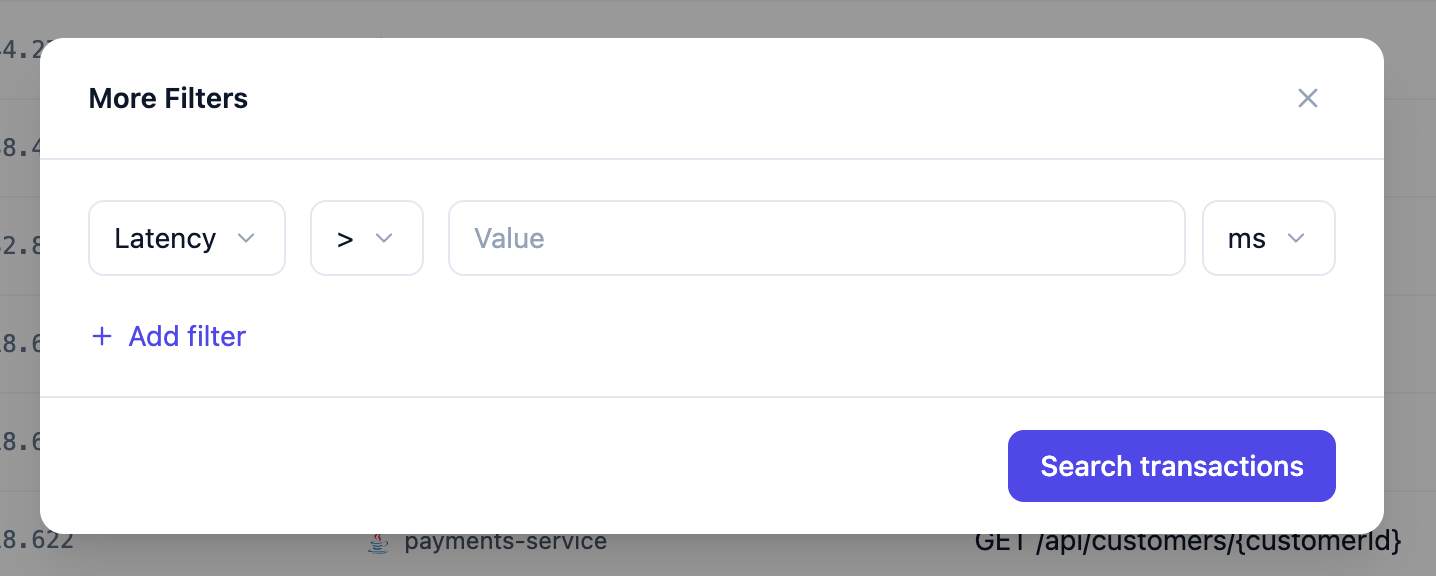
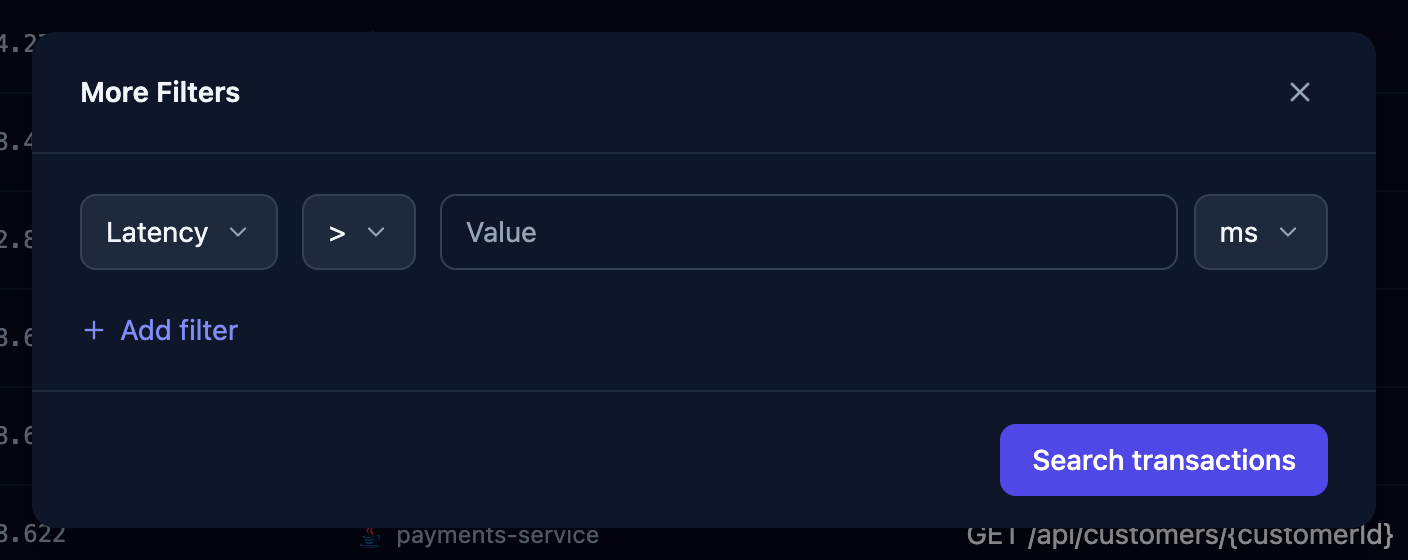 The current additional filters are:
| Filter | Description |
| ------------------ | ----------------------------------------------------------------------------------------------- |
| `Latency` | Set a minimum or maximum duration in milliseconds or seconds to focus on slow or fast requests. |
| `HTTP Status Code` | Filter to all 4xx errors, all 5xx errors, or a specific code like 404 or 503. |
| `Endpoint` | Filter by the endpoint that handled the request. |
| `Log Search` | Show only transactions where any of its log entries contain the search term. |
Filters are combined using **AND** logic, so only transactions matching all applied filters are returned, including any already set in the Transactions screen, such as `Service` or `Time Period`.
### Transaction Detail
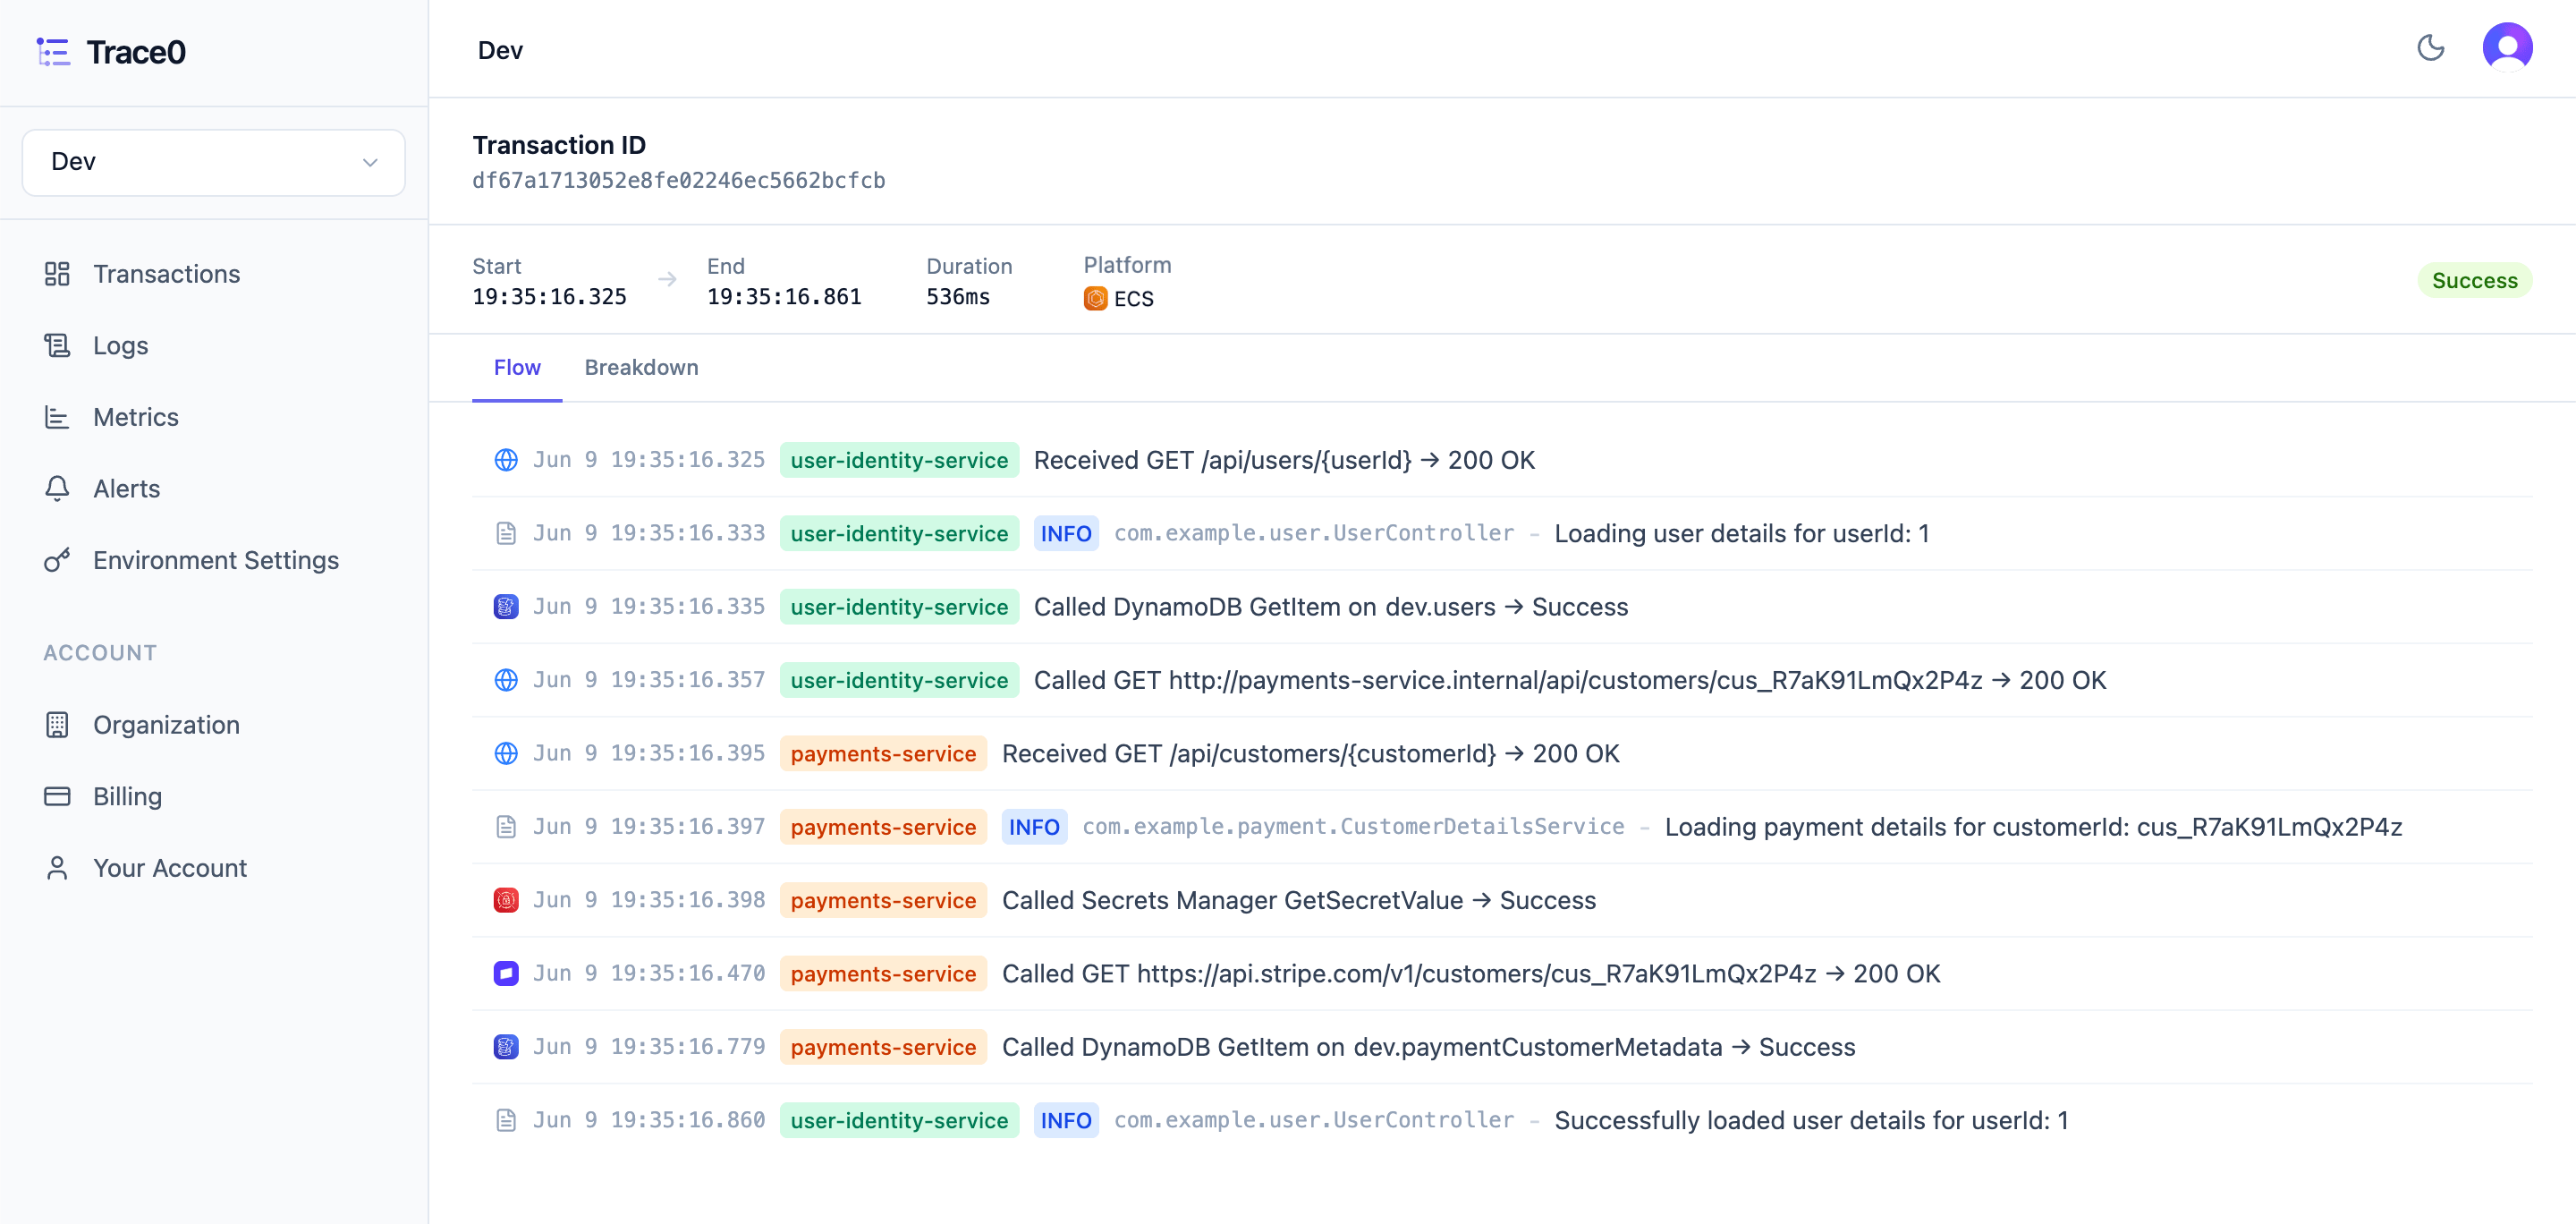
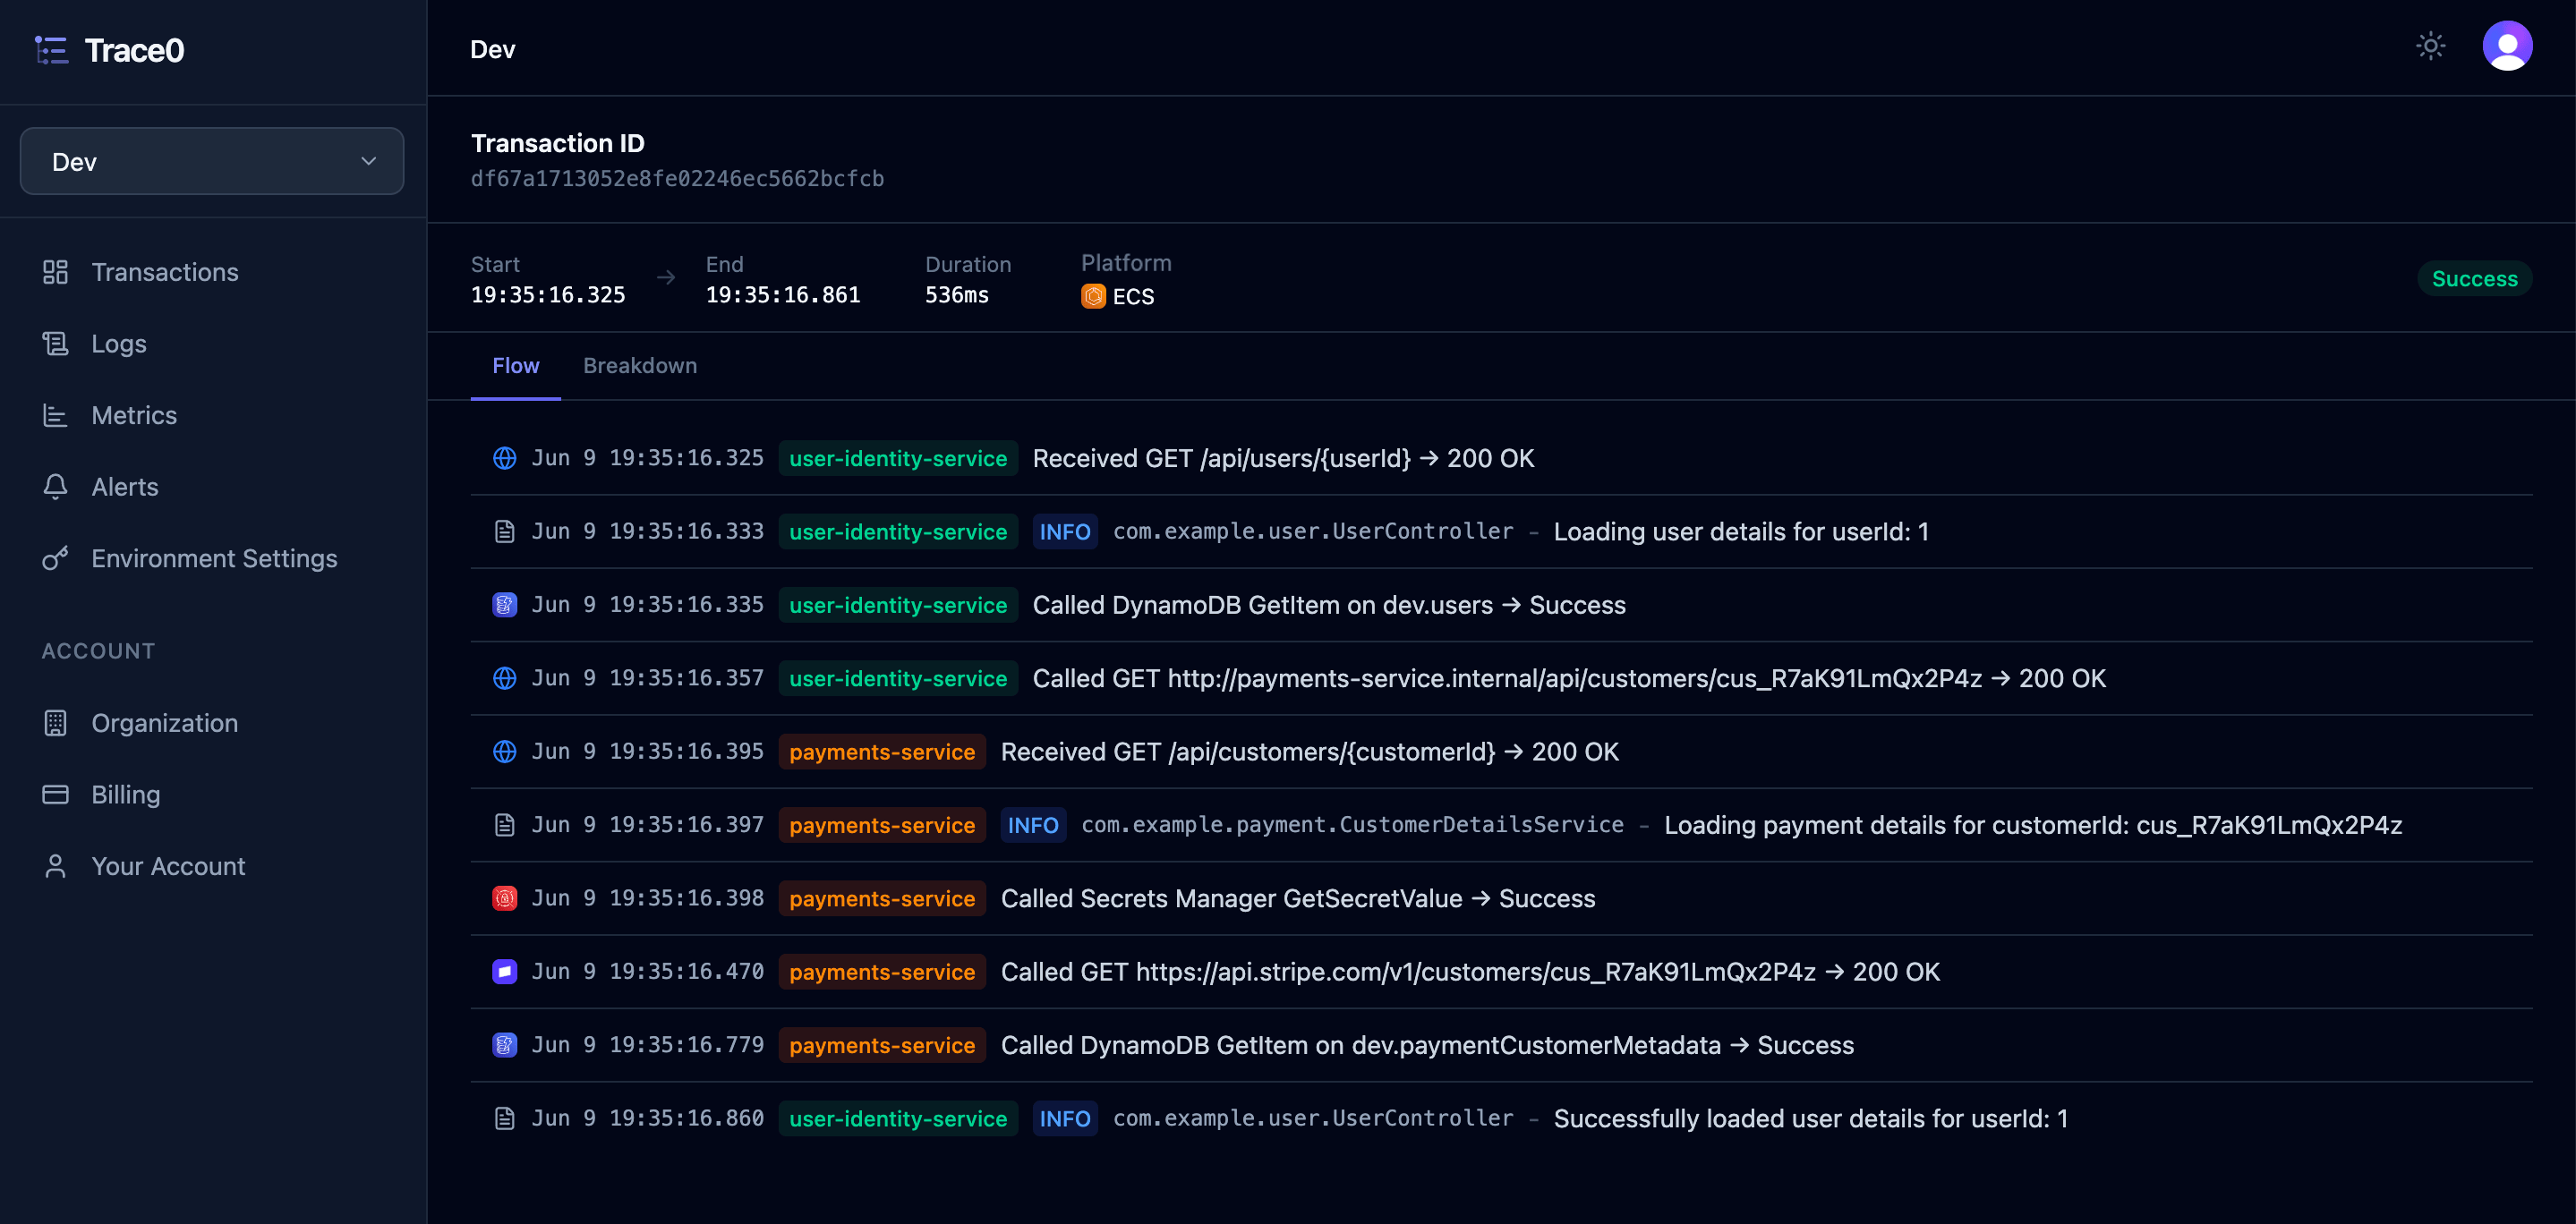
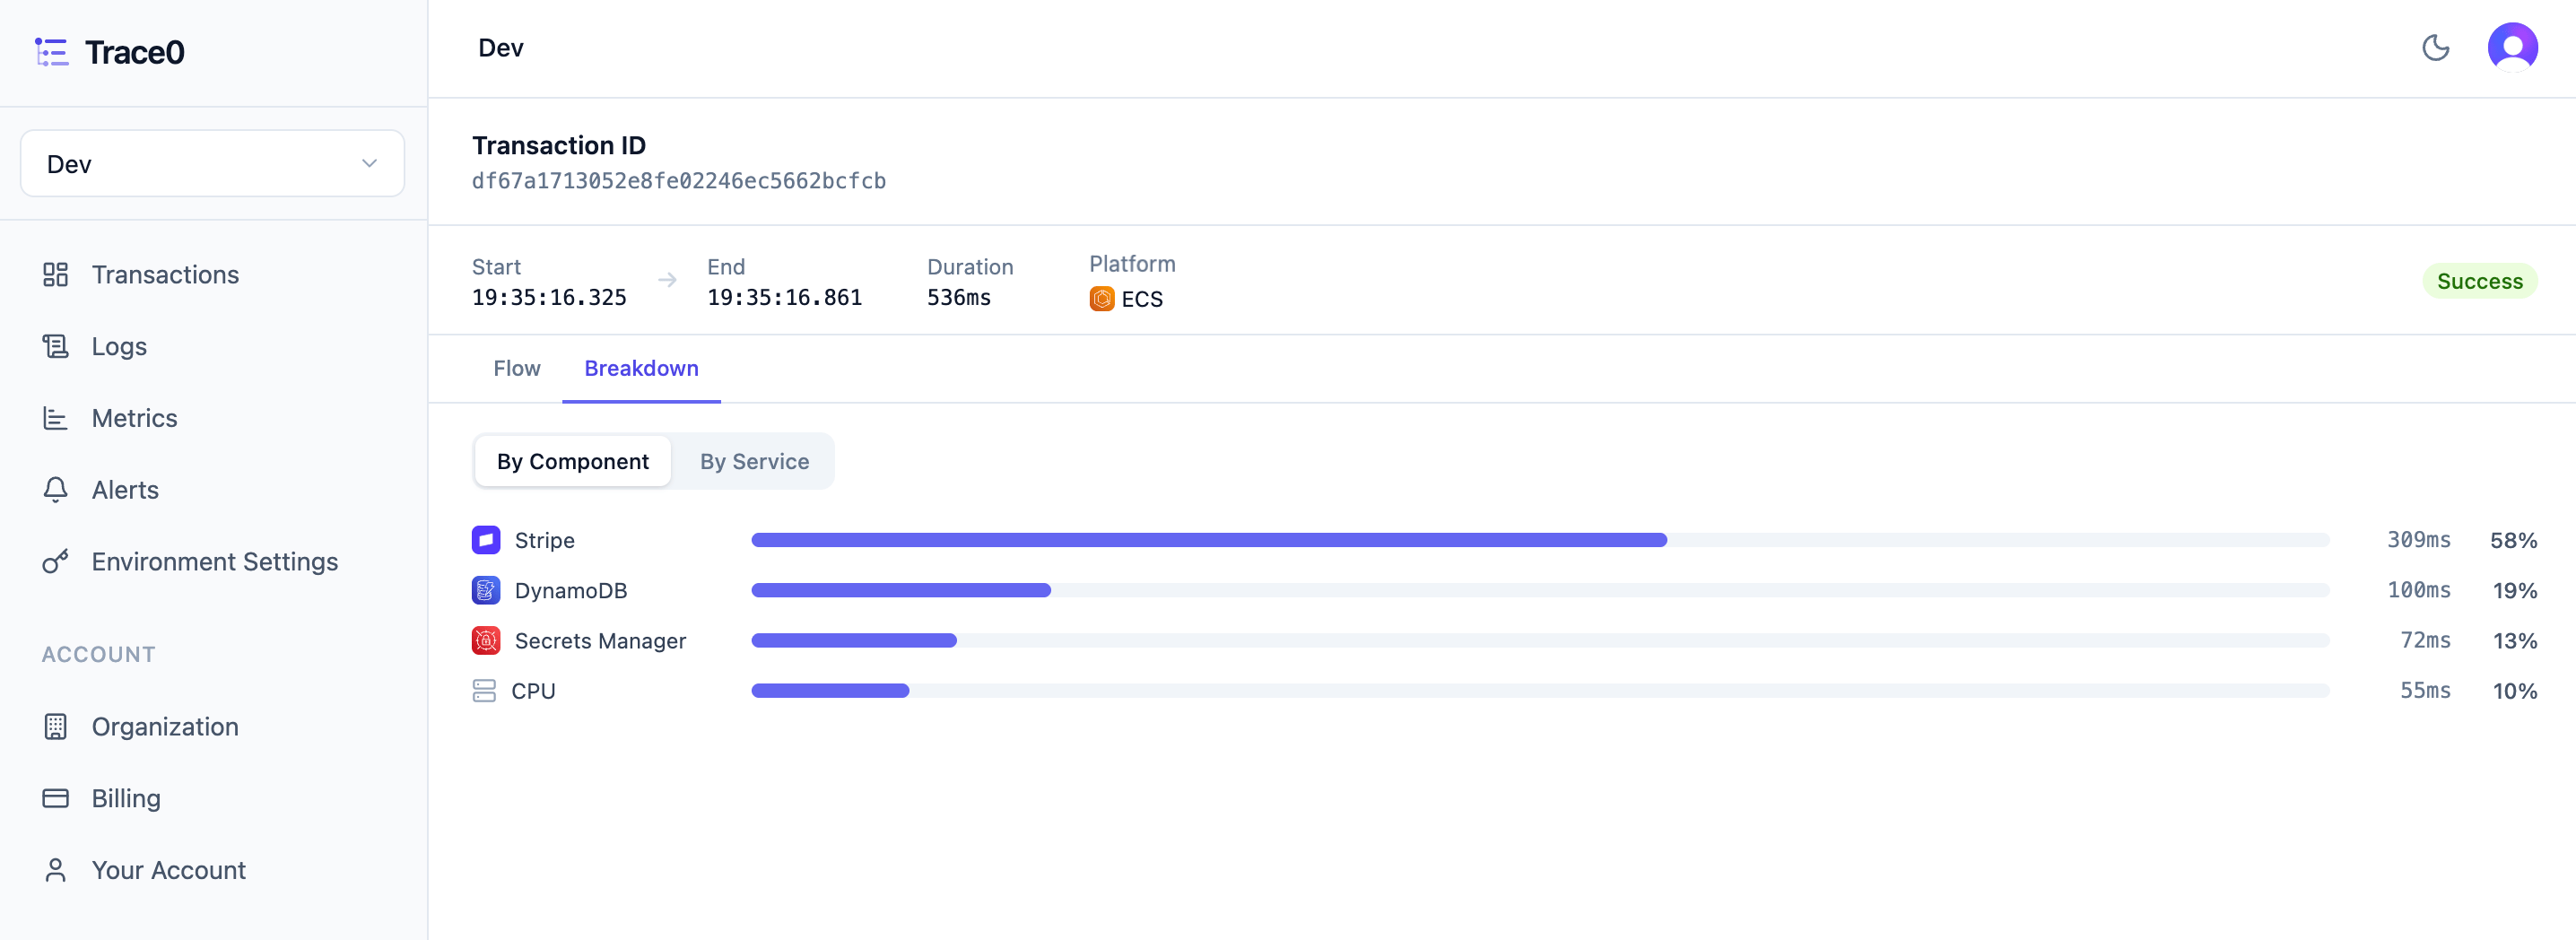
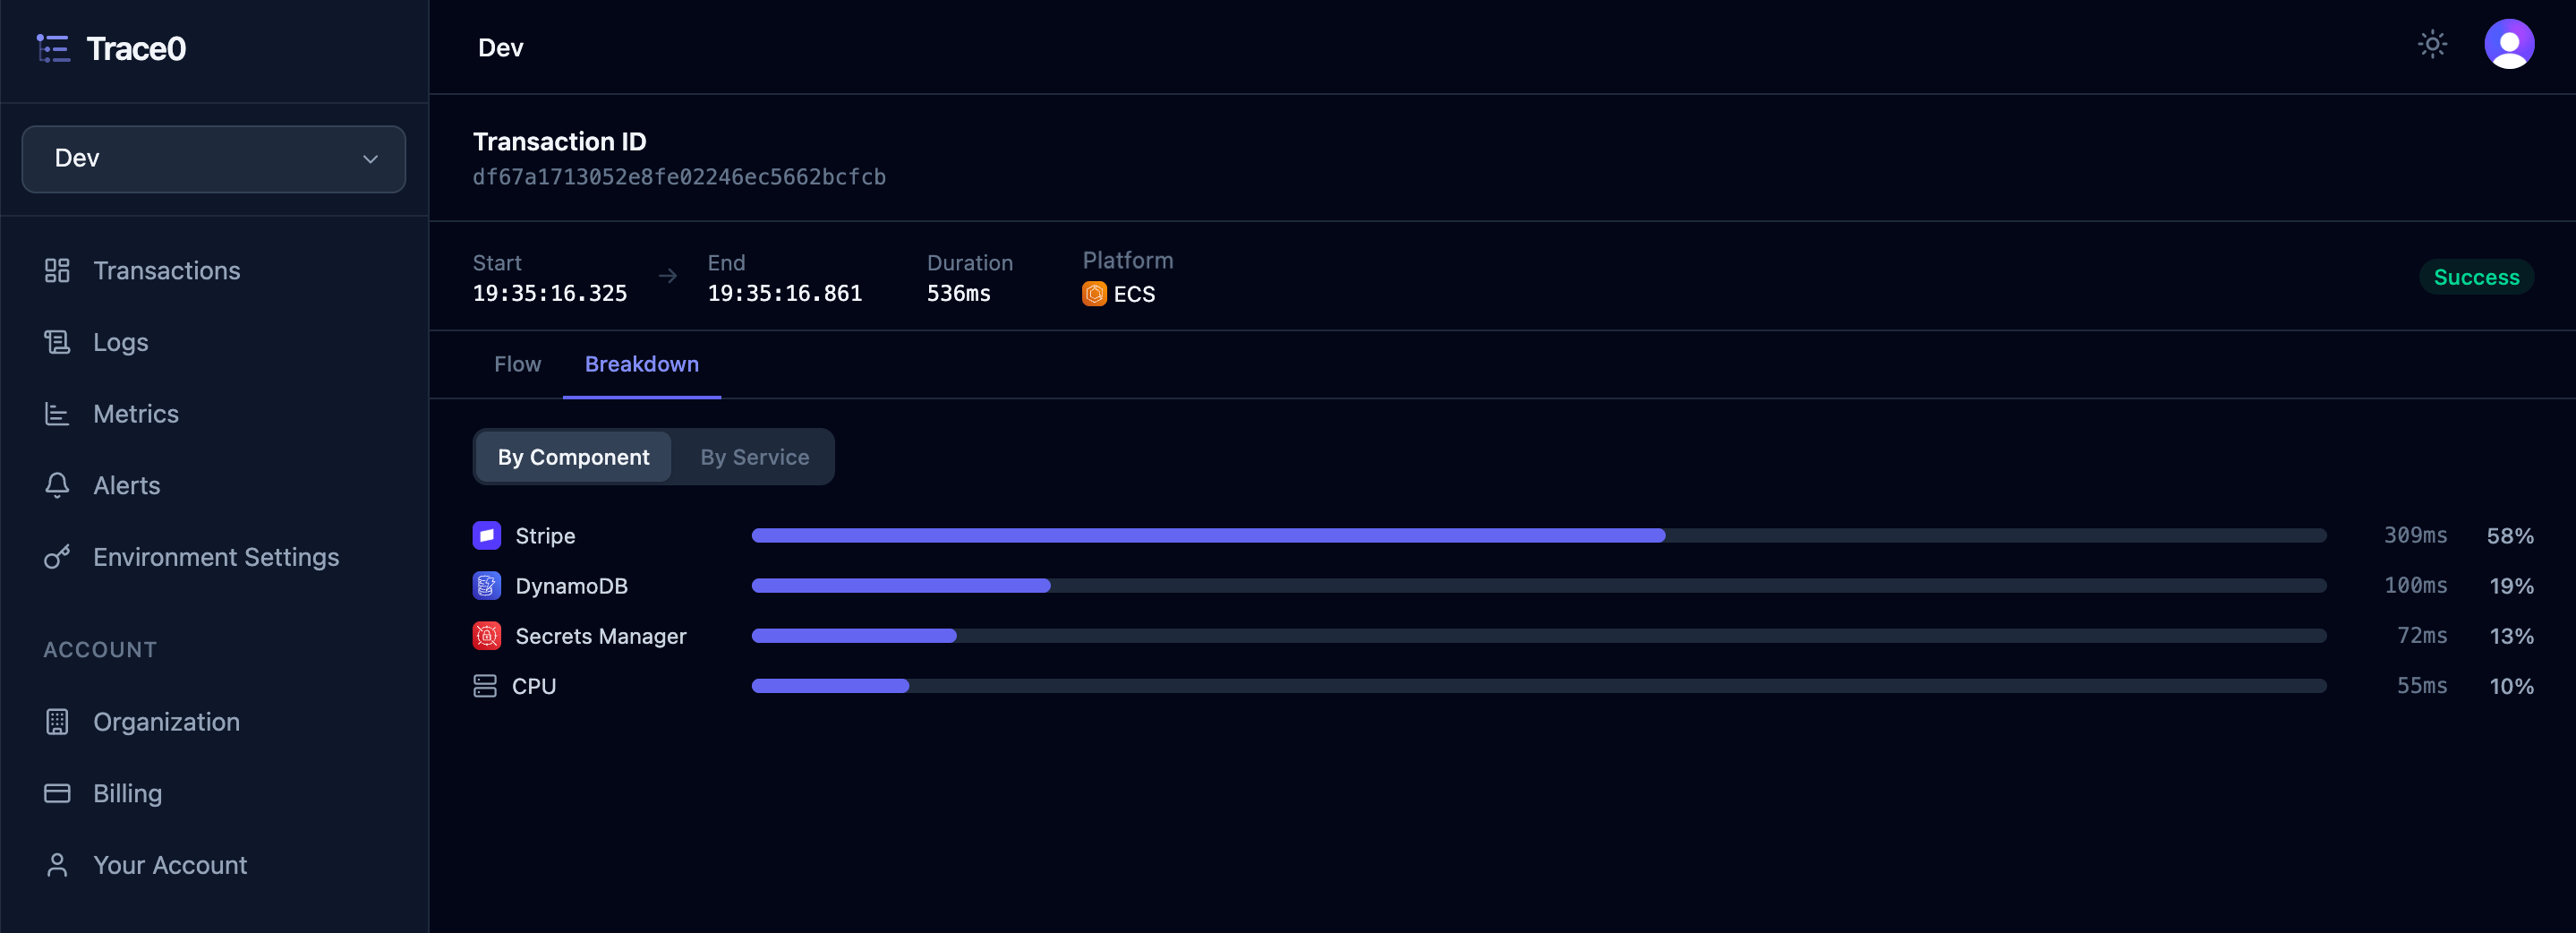
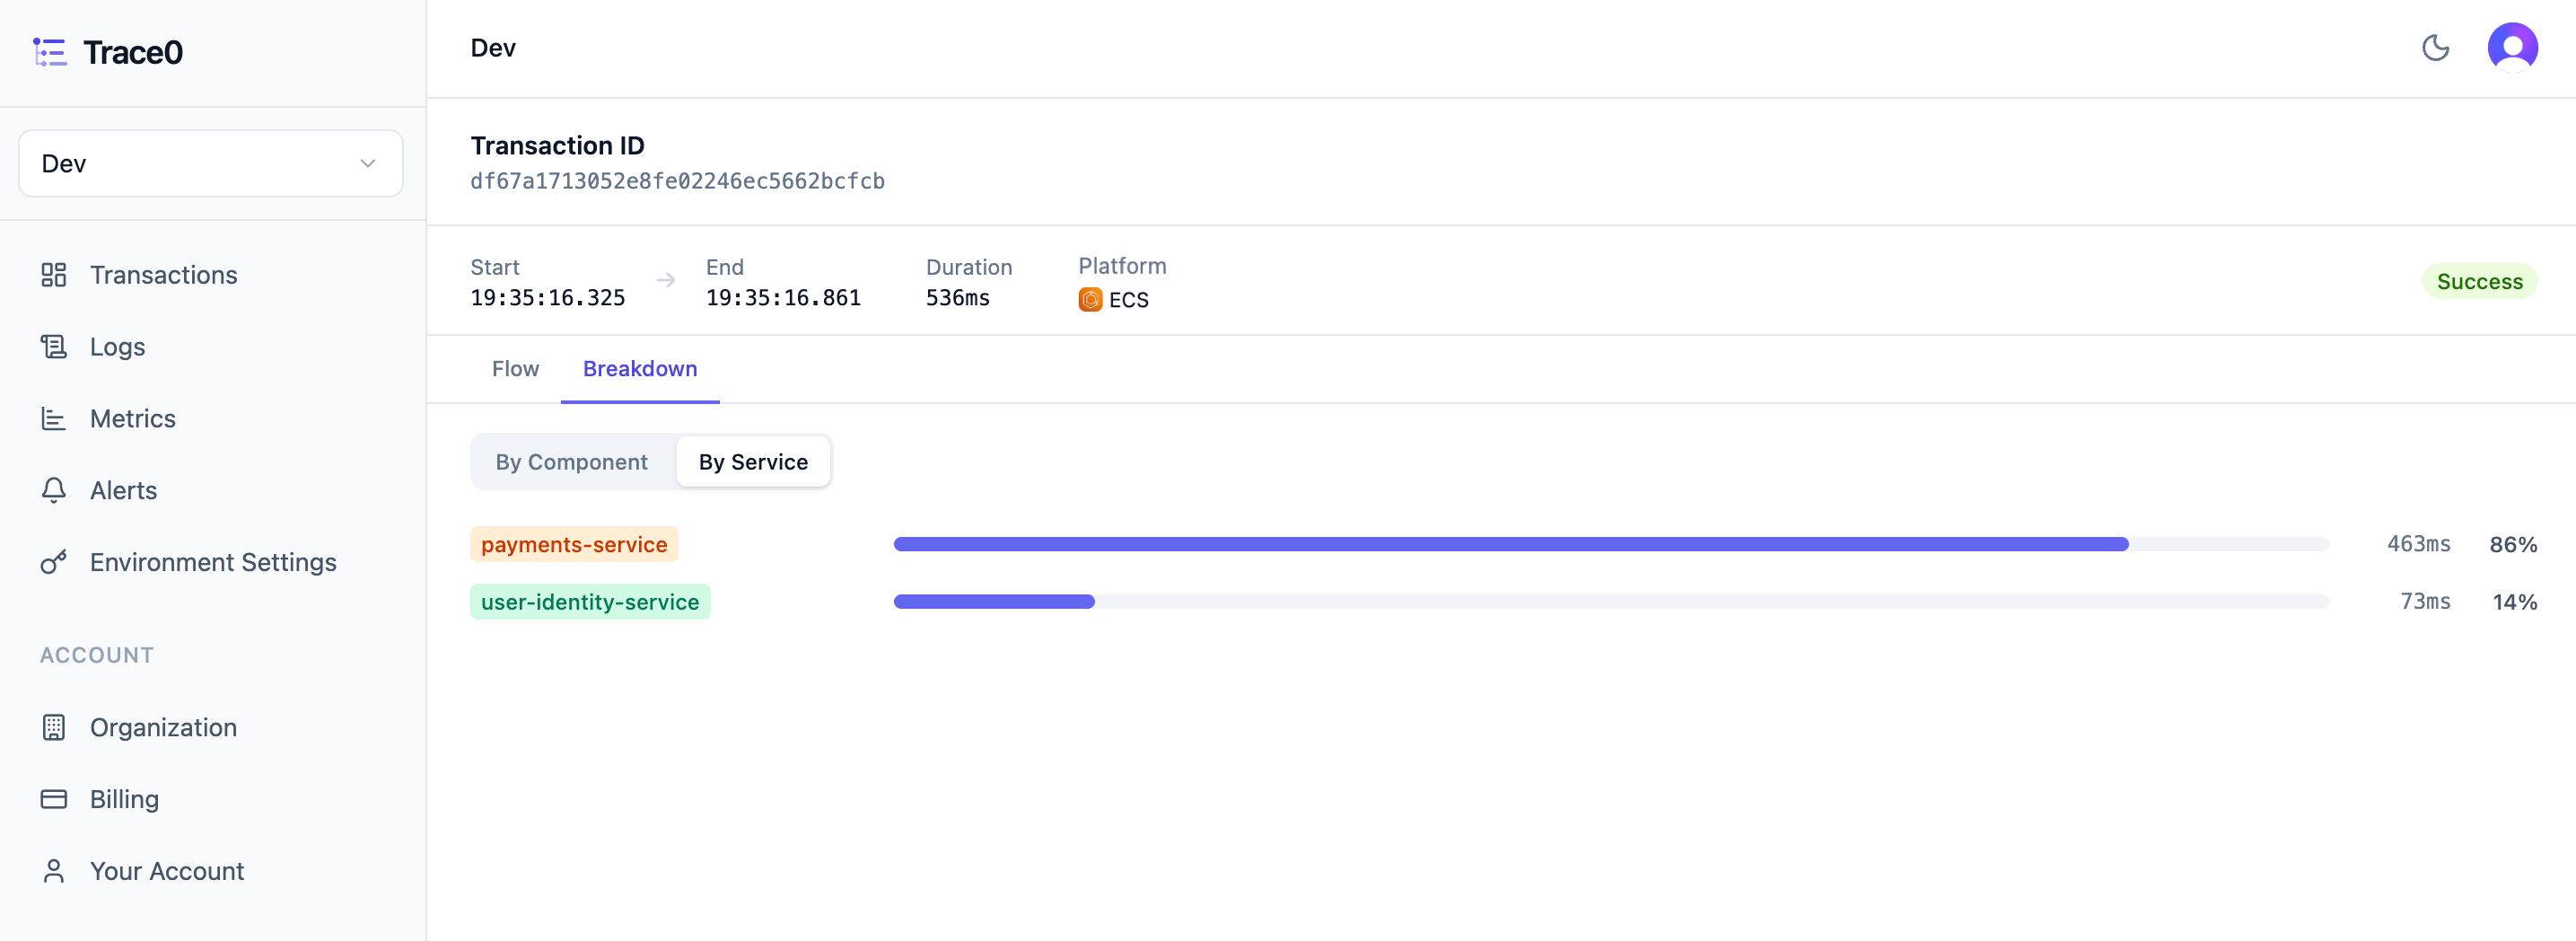
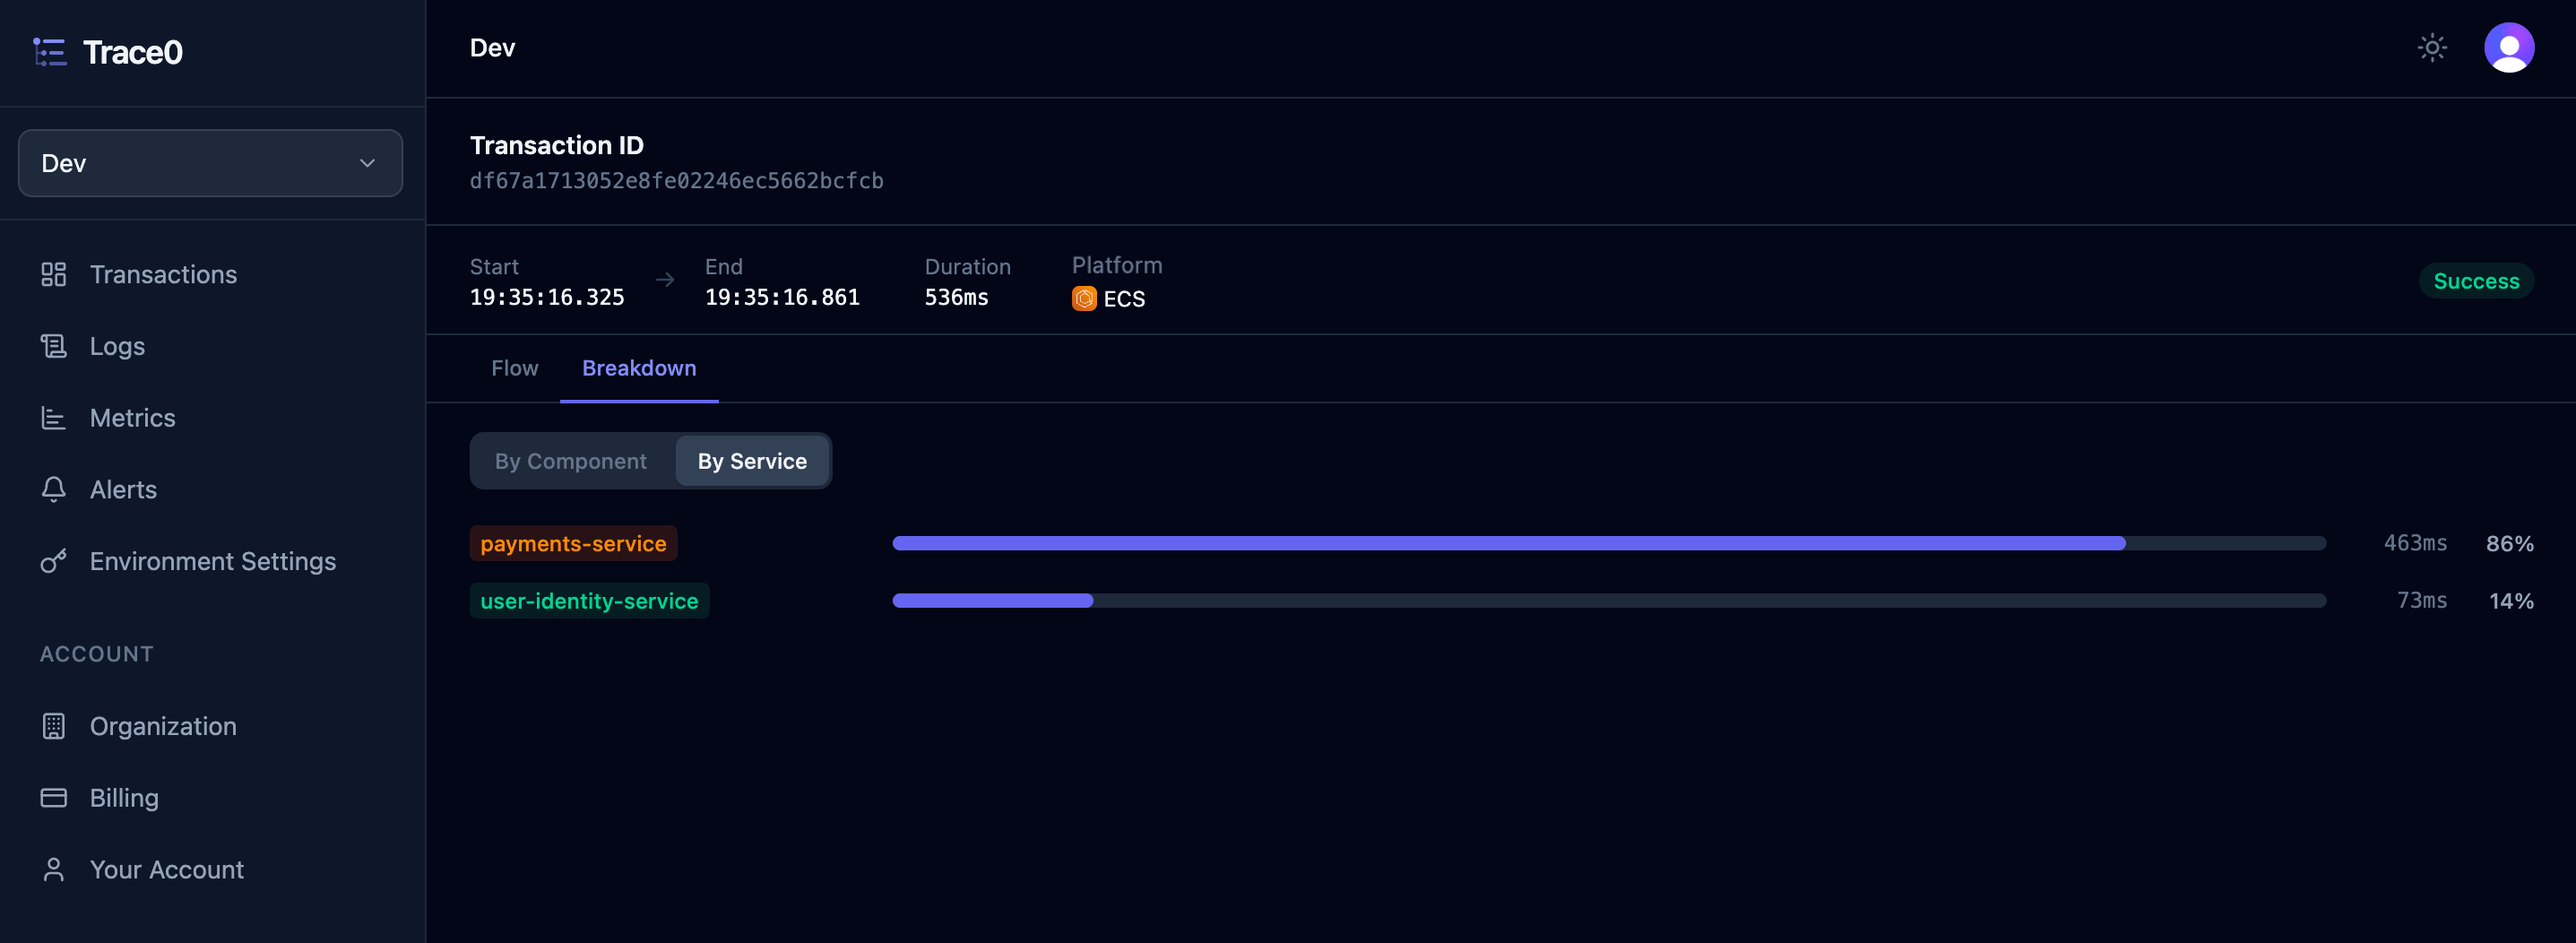
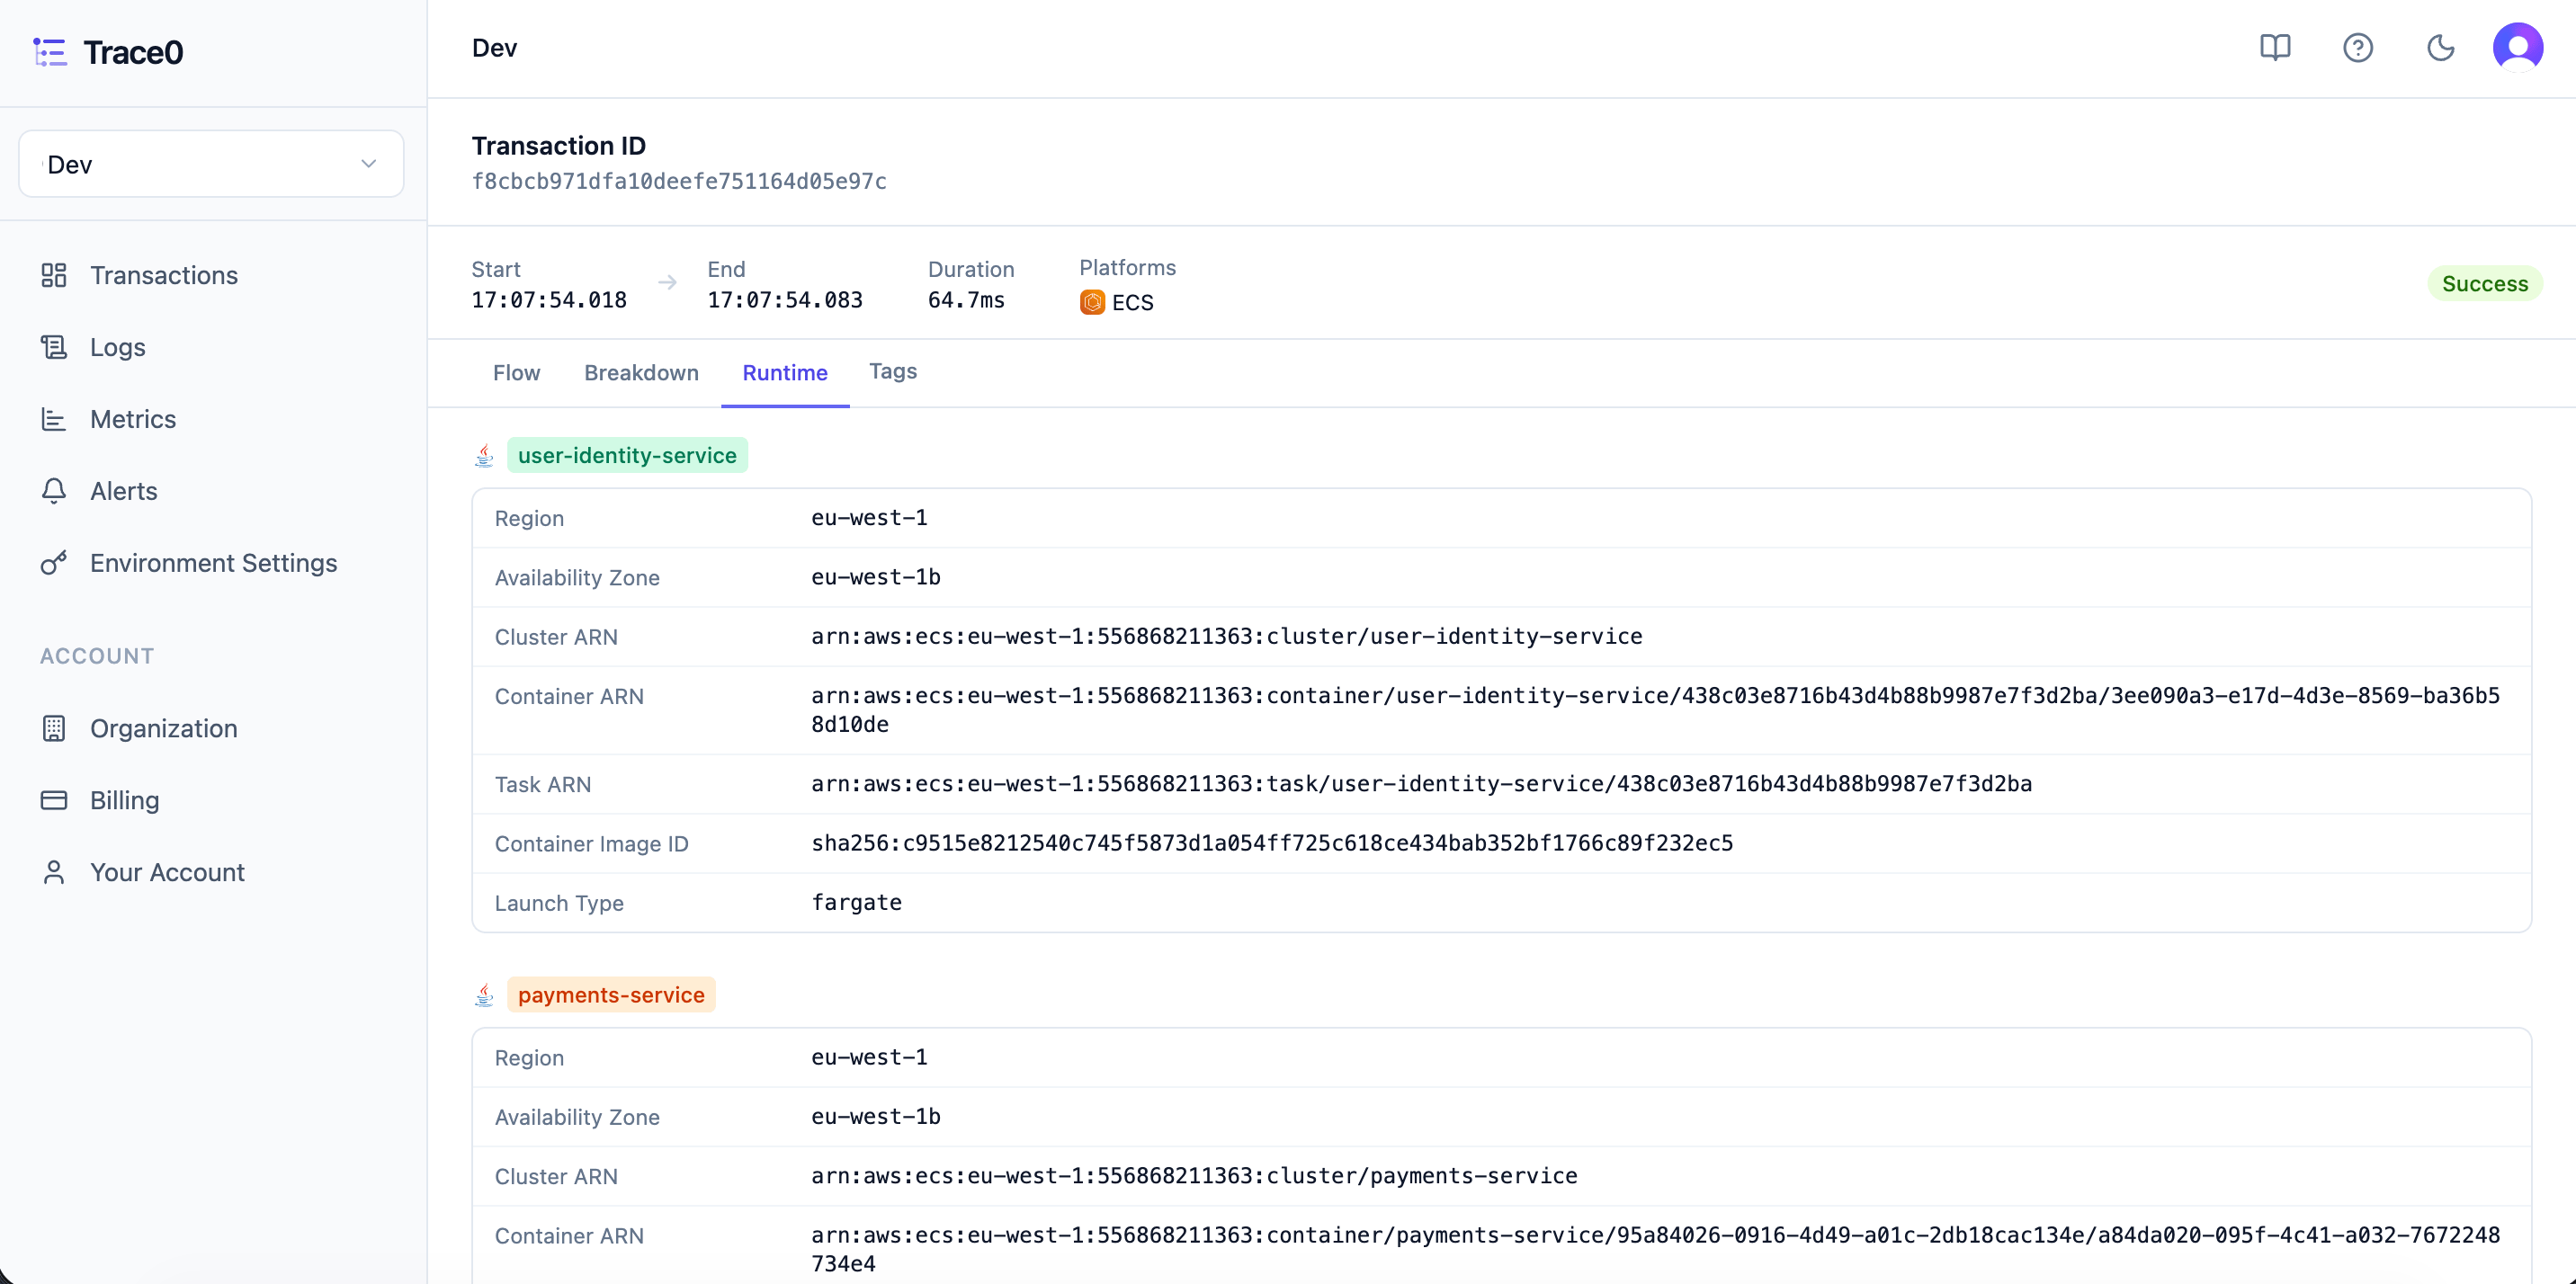
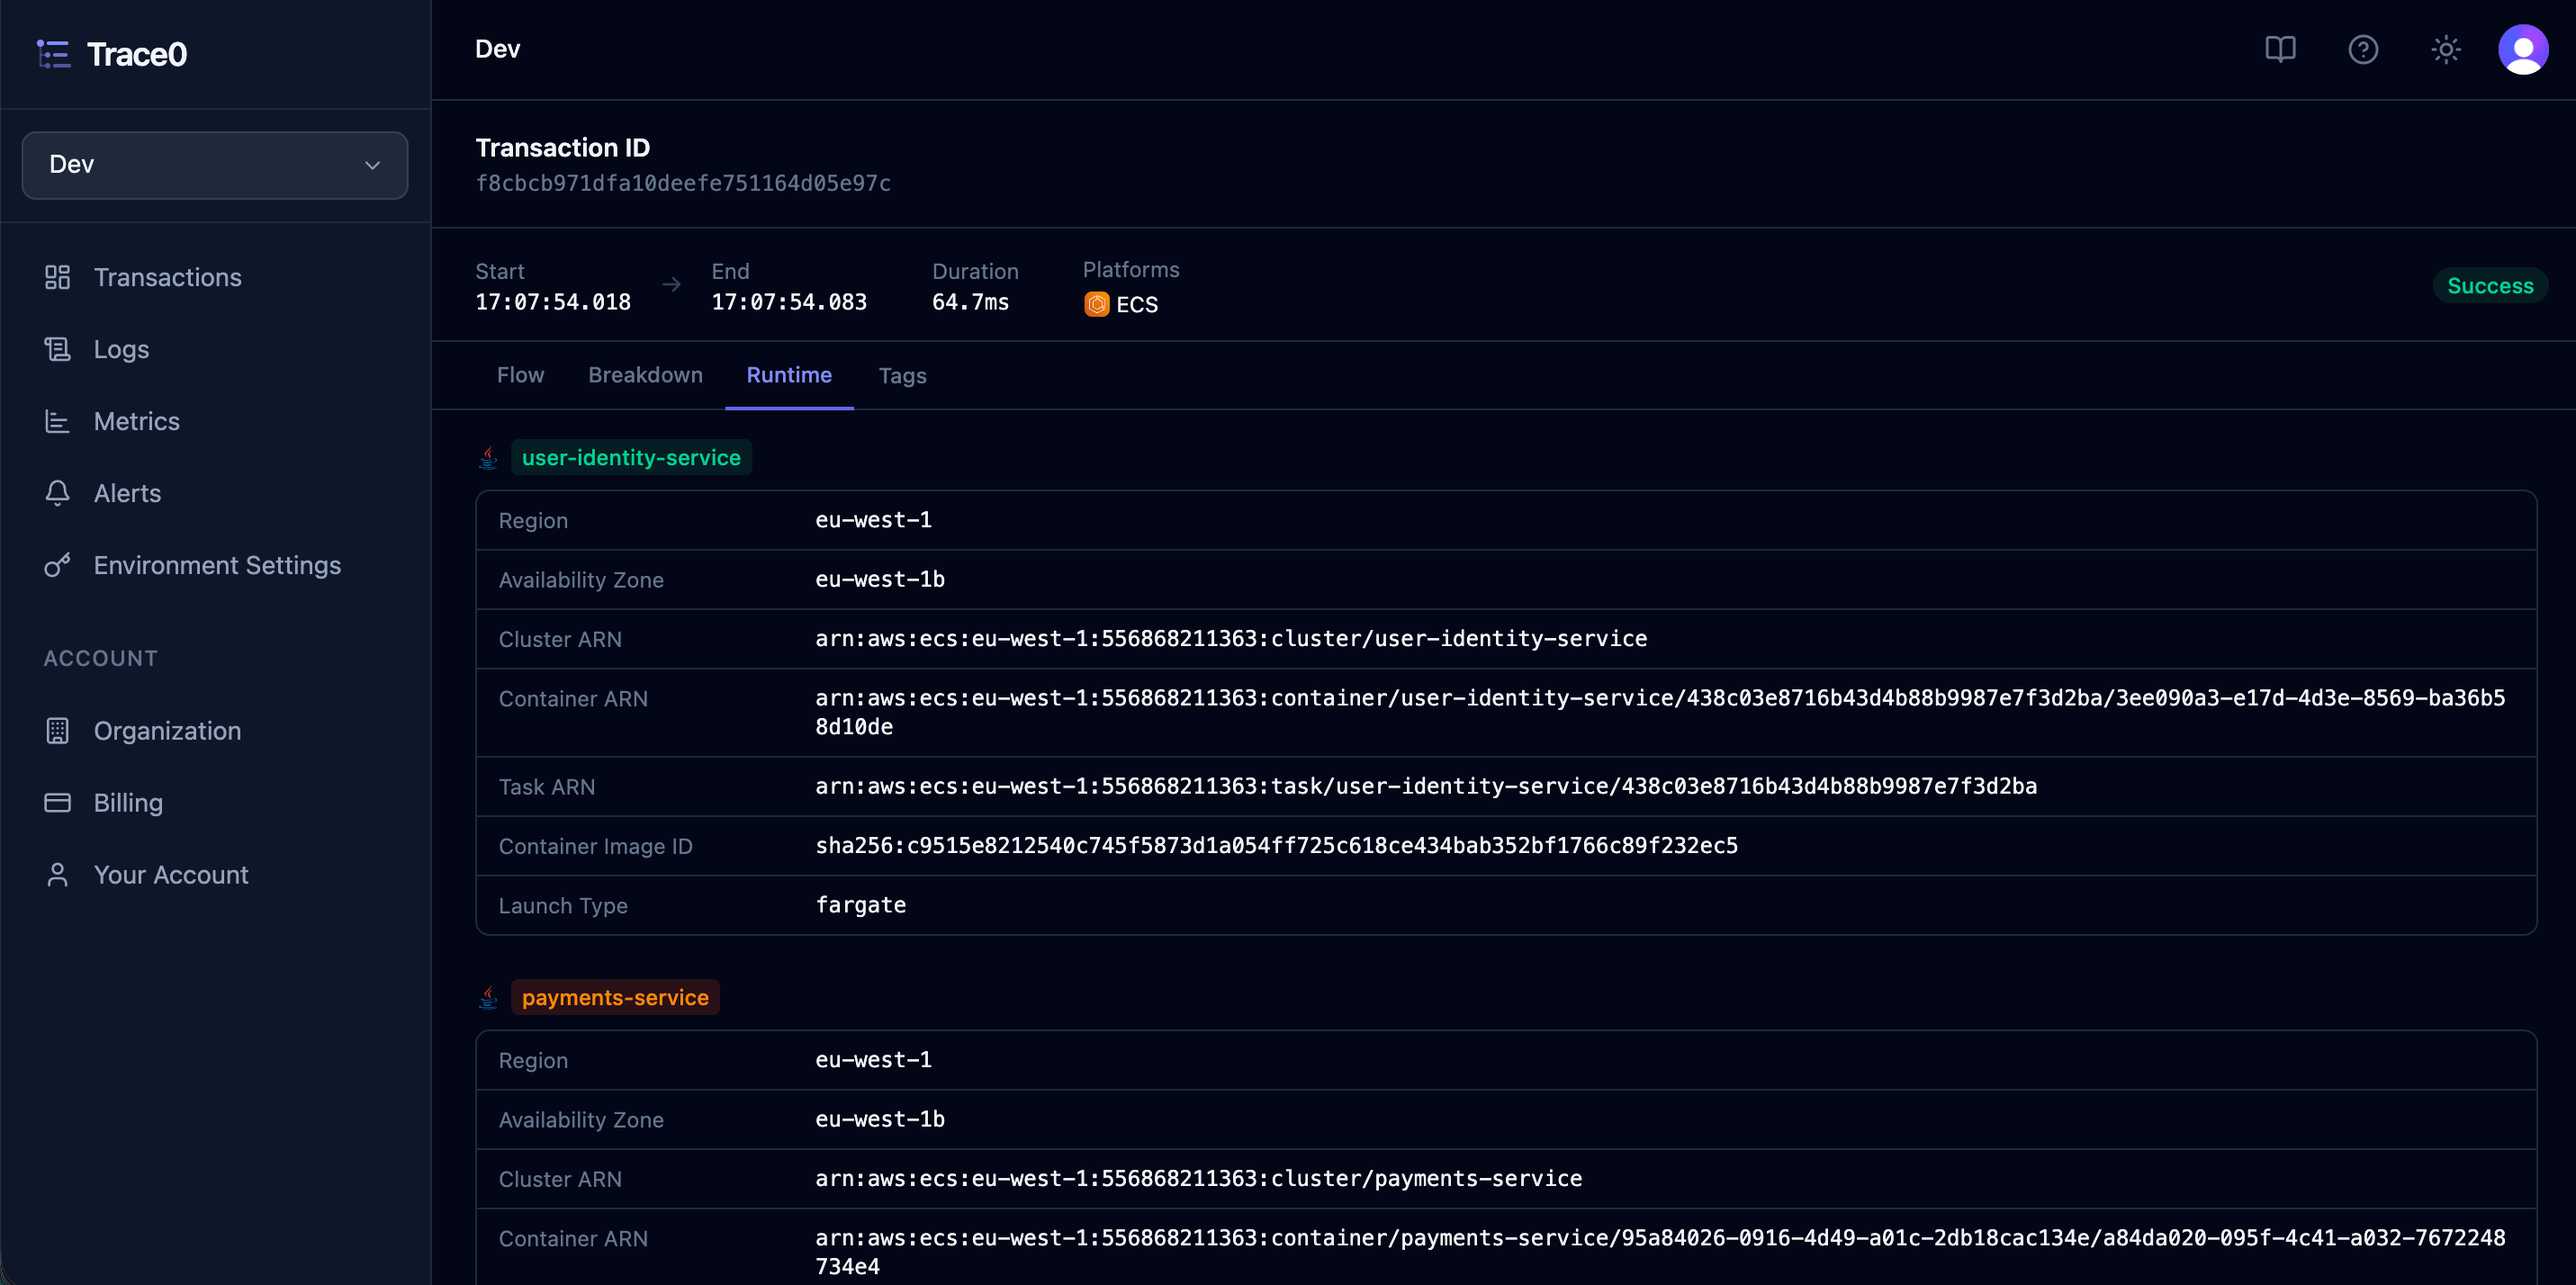
To view more details for a single transaction, click on it to see a full breakdown — including all spans, logs, and time taken across each component and service:
The current additional filters are:
| Filter | Description |
| ------------------ | ----------------------------------------------------------------------------------------------- |
| `Latency` | Set a minimum or maximum duration in milliseconds or seconds to focus on slow or fast requests. |
| `HTTP Status Code` | Filter to all 4xx errors, all 5xx errors, or a specific code like 404 or 503. |
| `Endpoint` | Filter by the endpoint that handled the request. |
| `Log Search` | Show only transactions where any of its log entries contain the search term. |
Filters are combined using **AND** logic, so only transactions matching all applied filters are returned, including any already set in the Transactions screen, such as `Service` or `Time Period`.
### Transaction Detail
To view more details for a single transaction, click on it to see a full breakdown — including all spans, logs, and time taken across each component and service:
 ### Errors
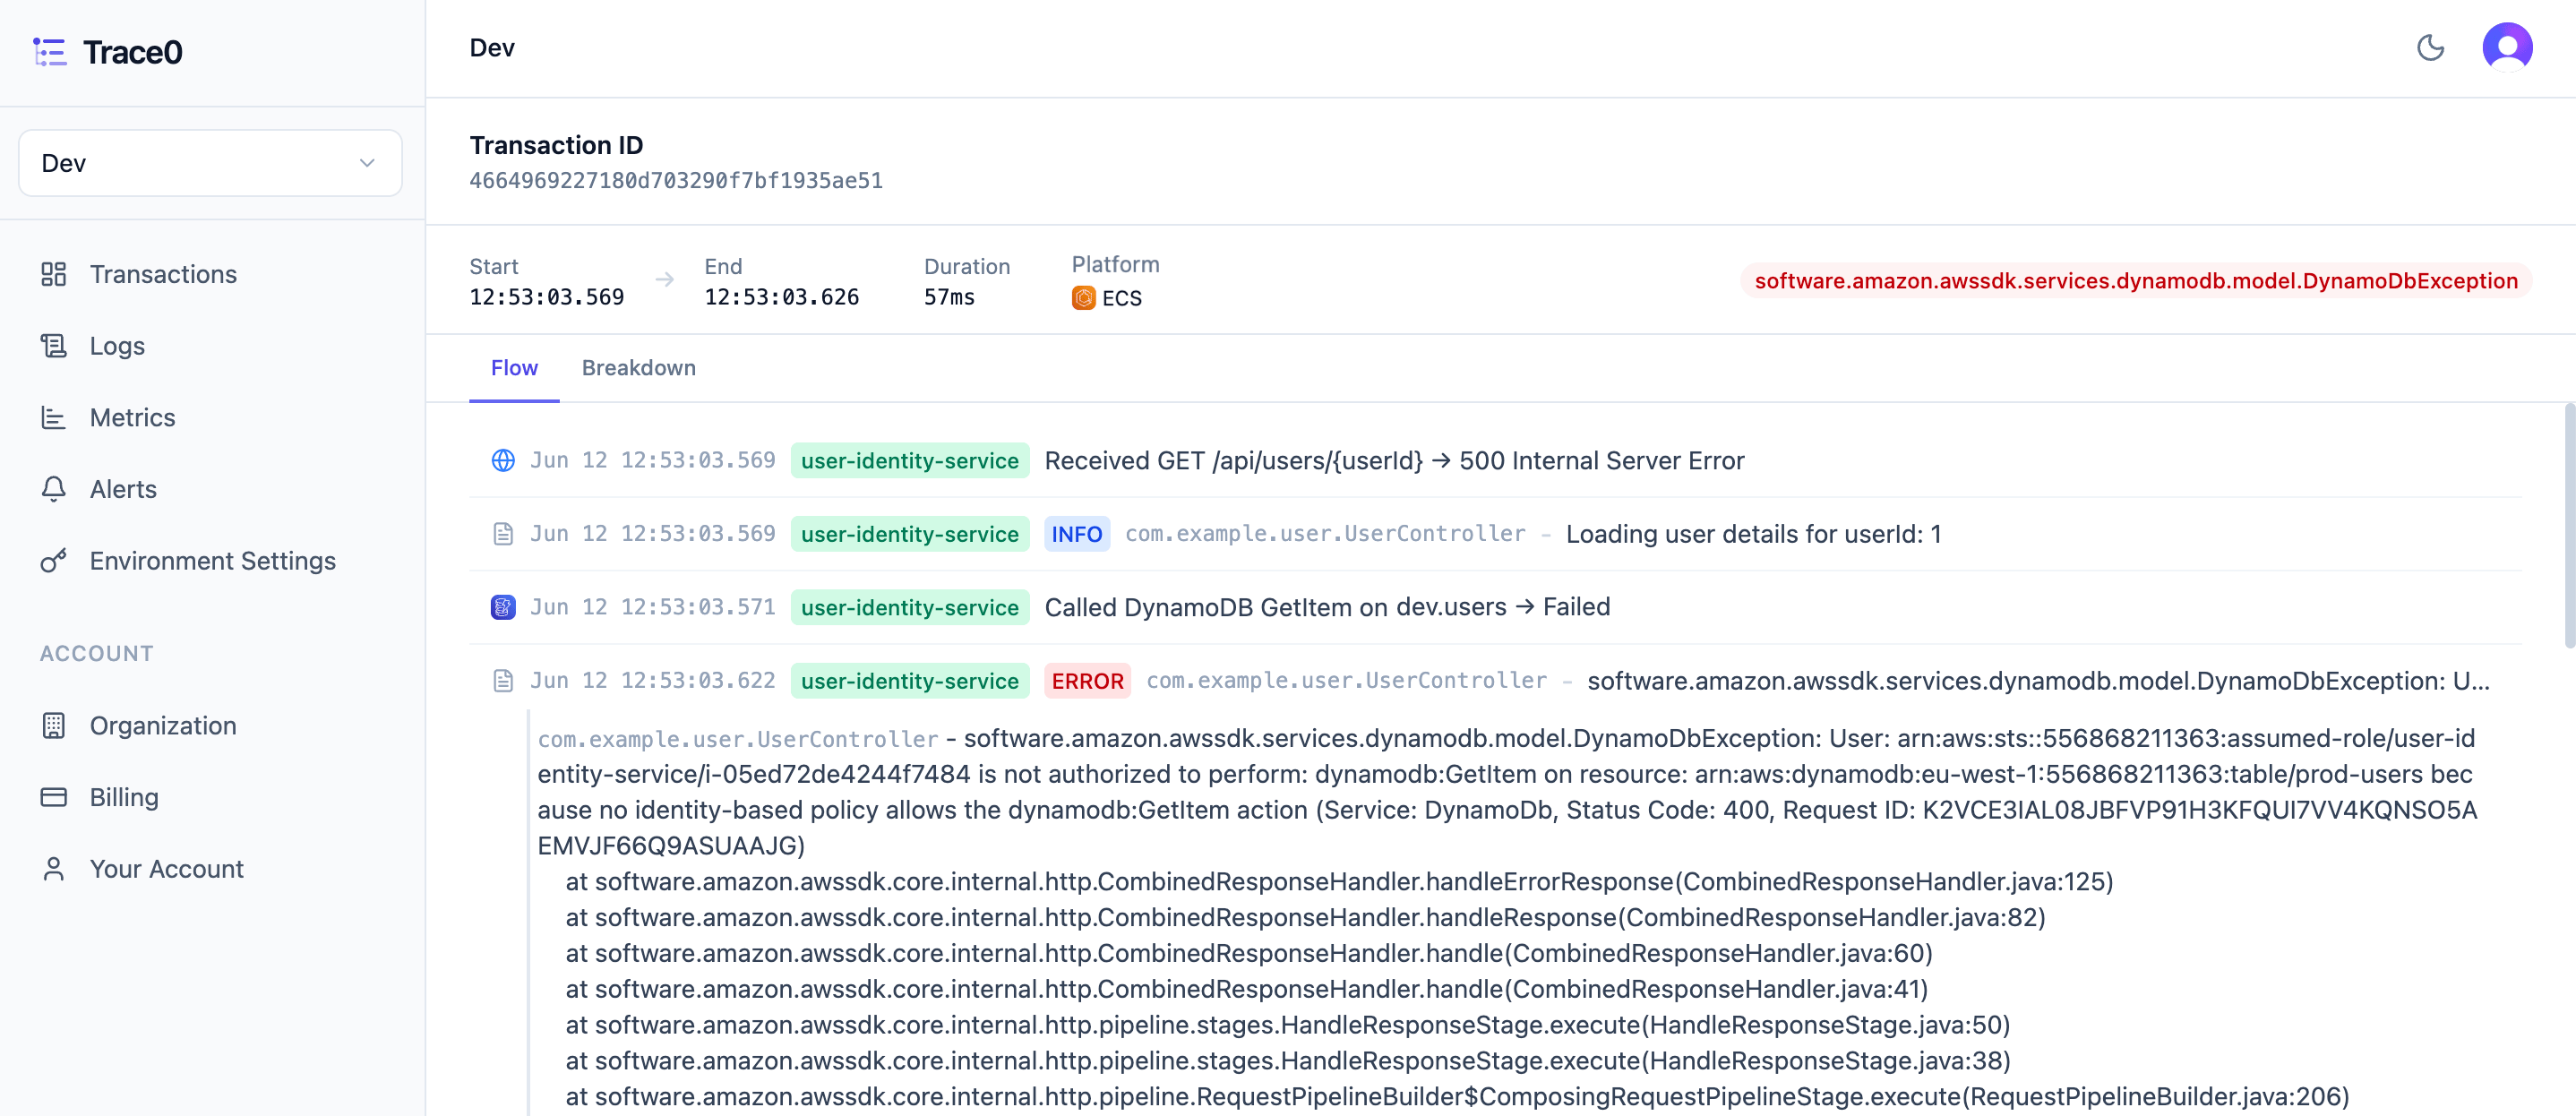
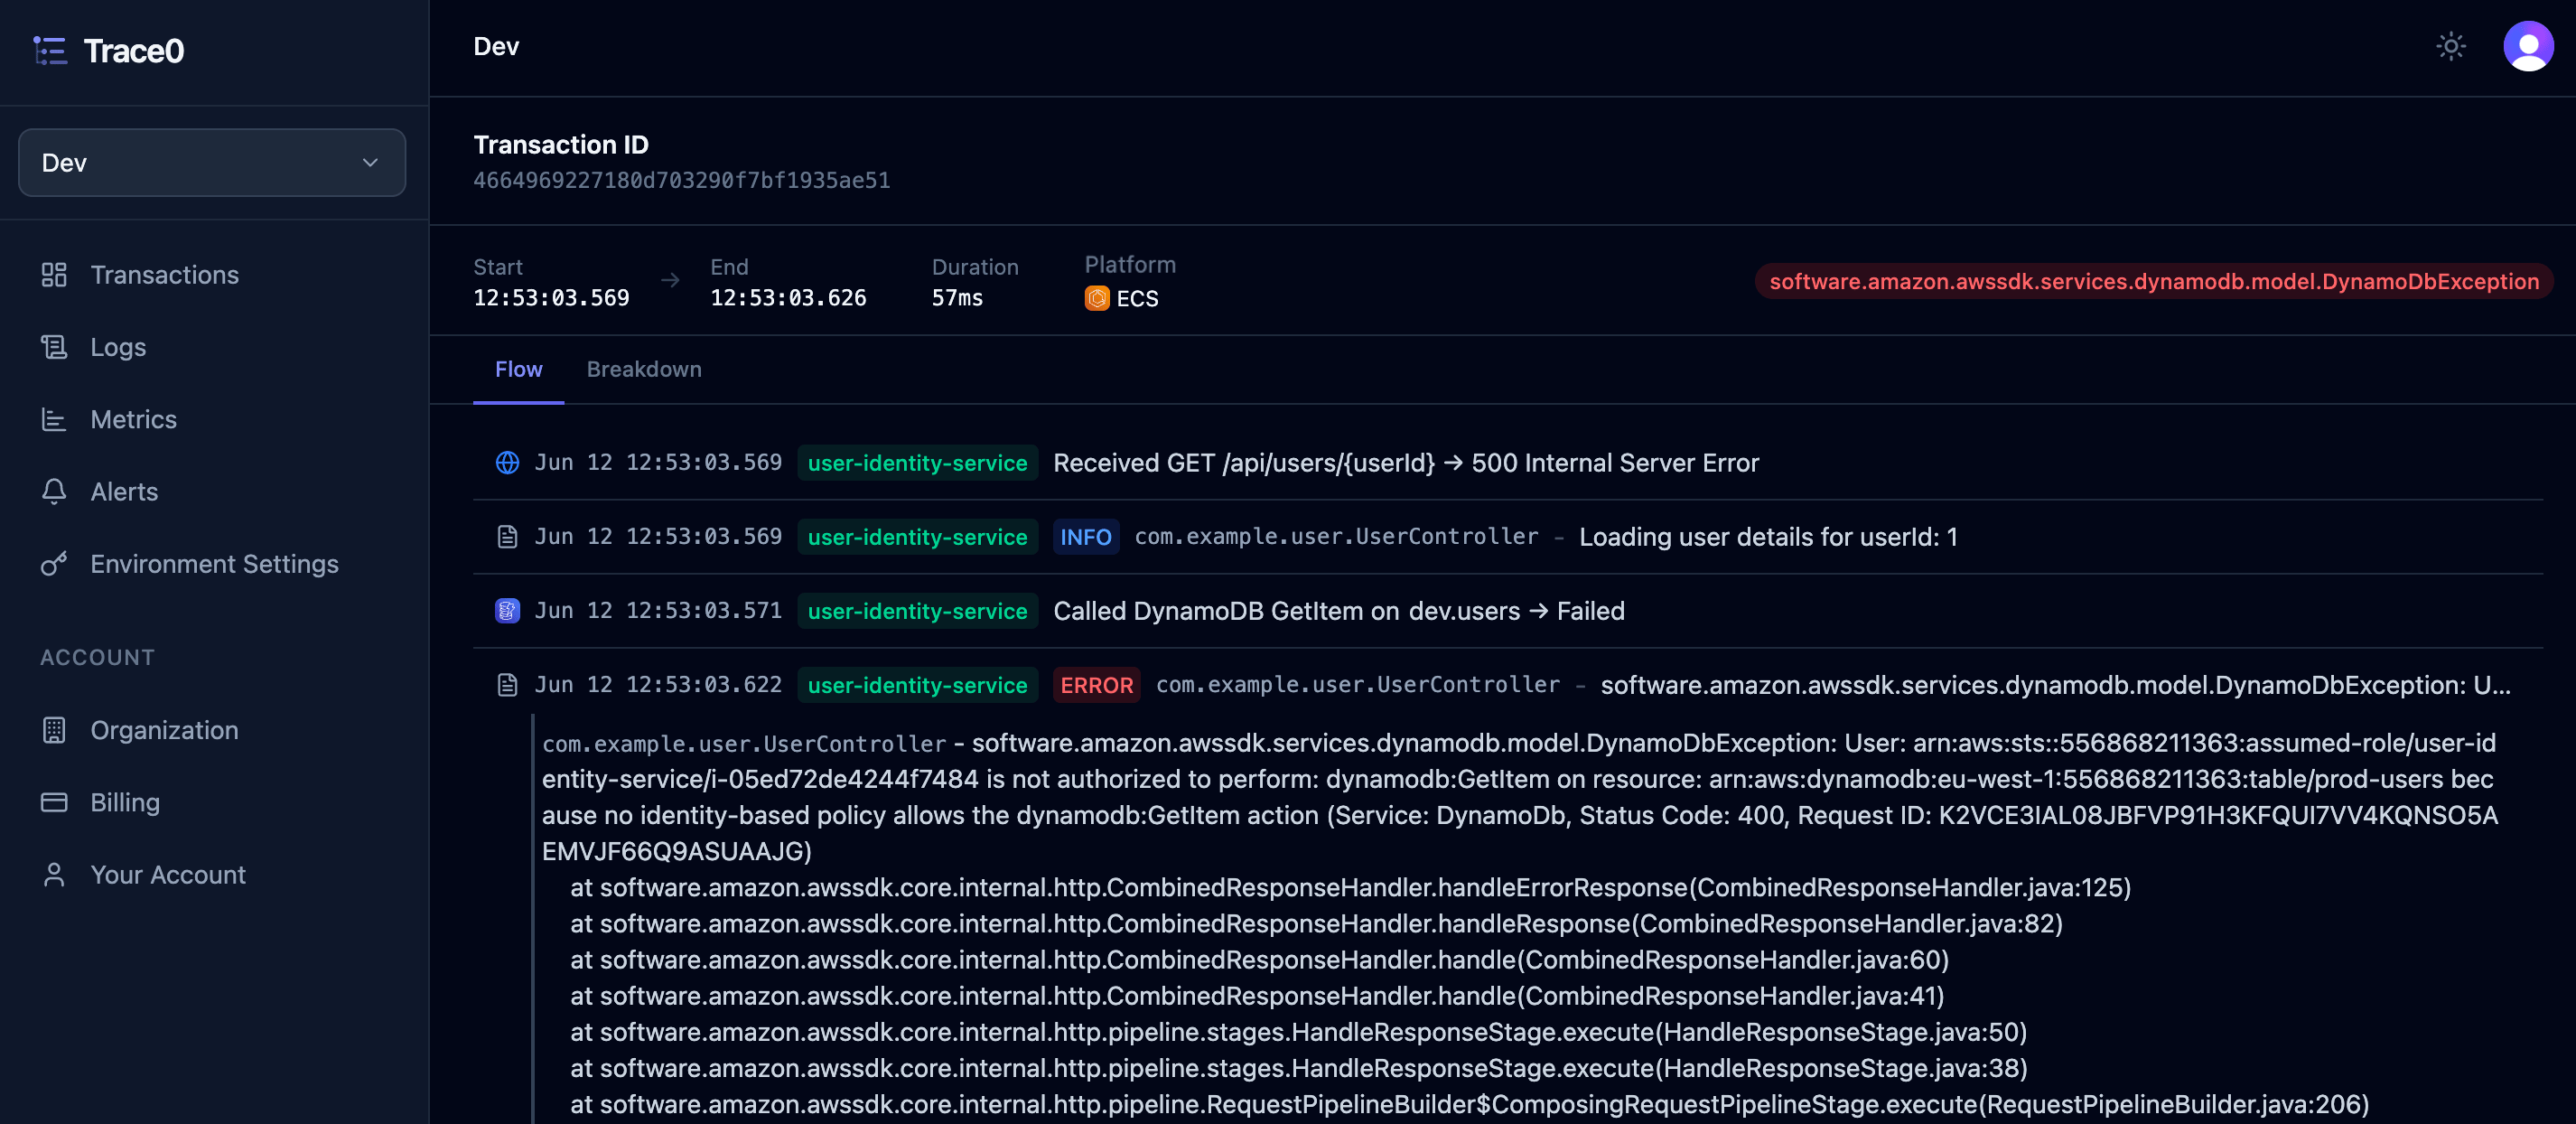
For transactions that fail, the transaction will appear as an error in Trace0, with the full error details and stack trace included:
### Errors
For transactions that fail, the transaction will appear as an error in Trace0, with the full error details and stack trace included:
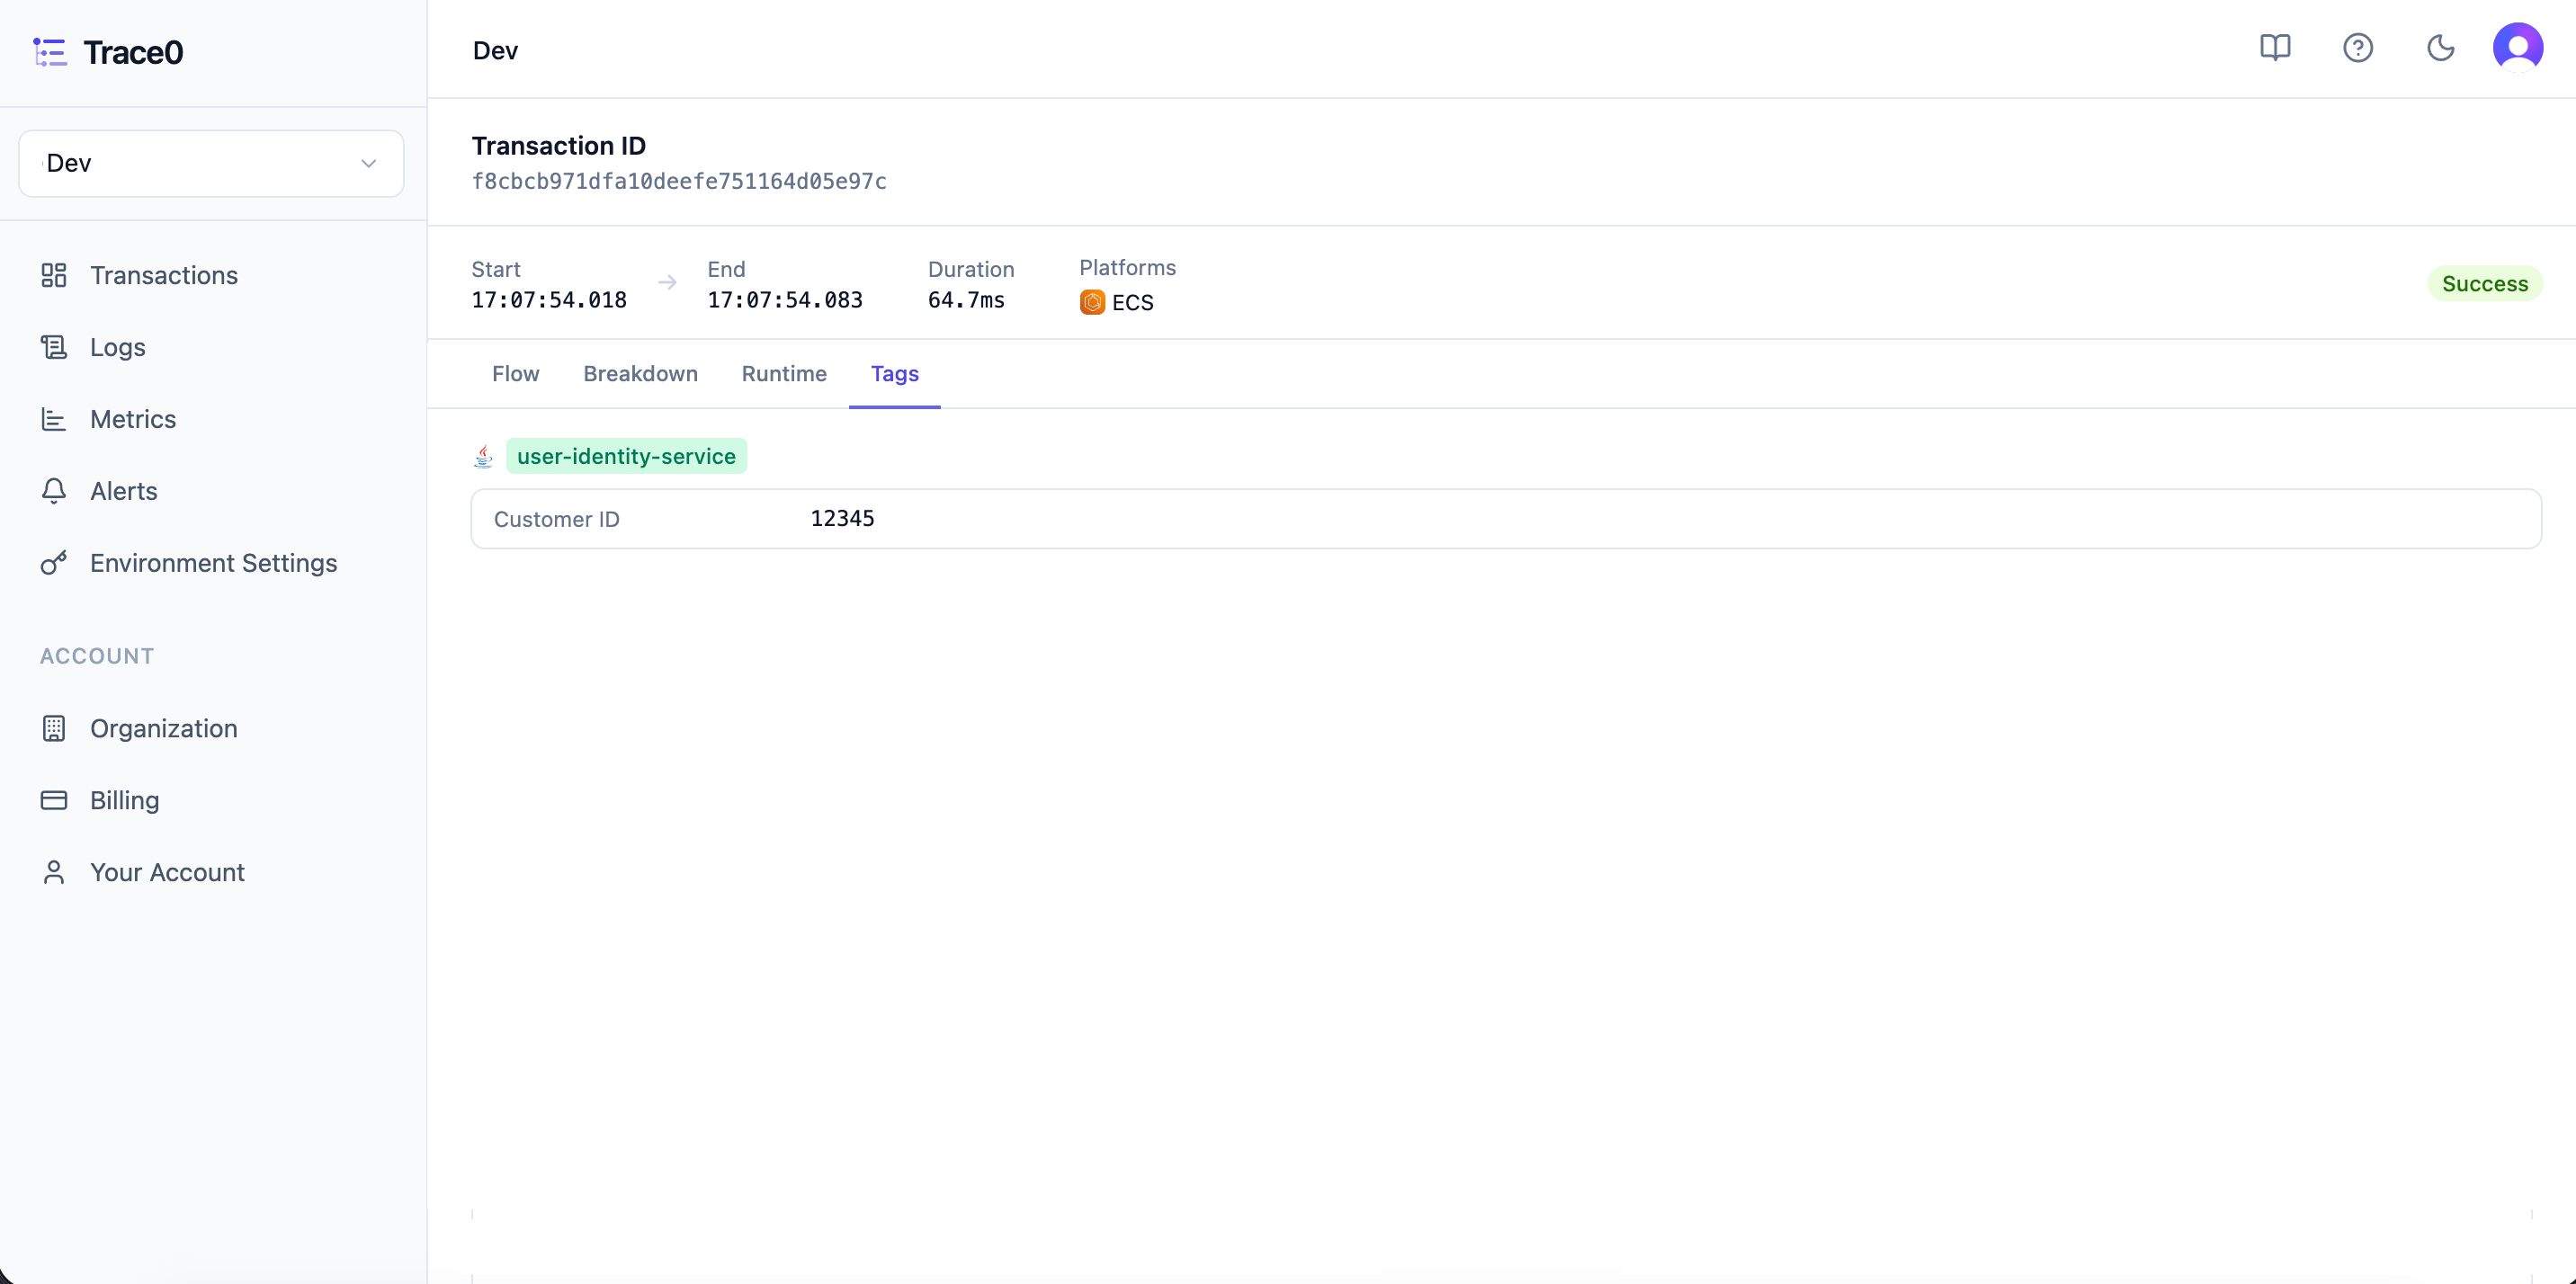
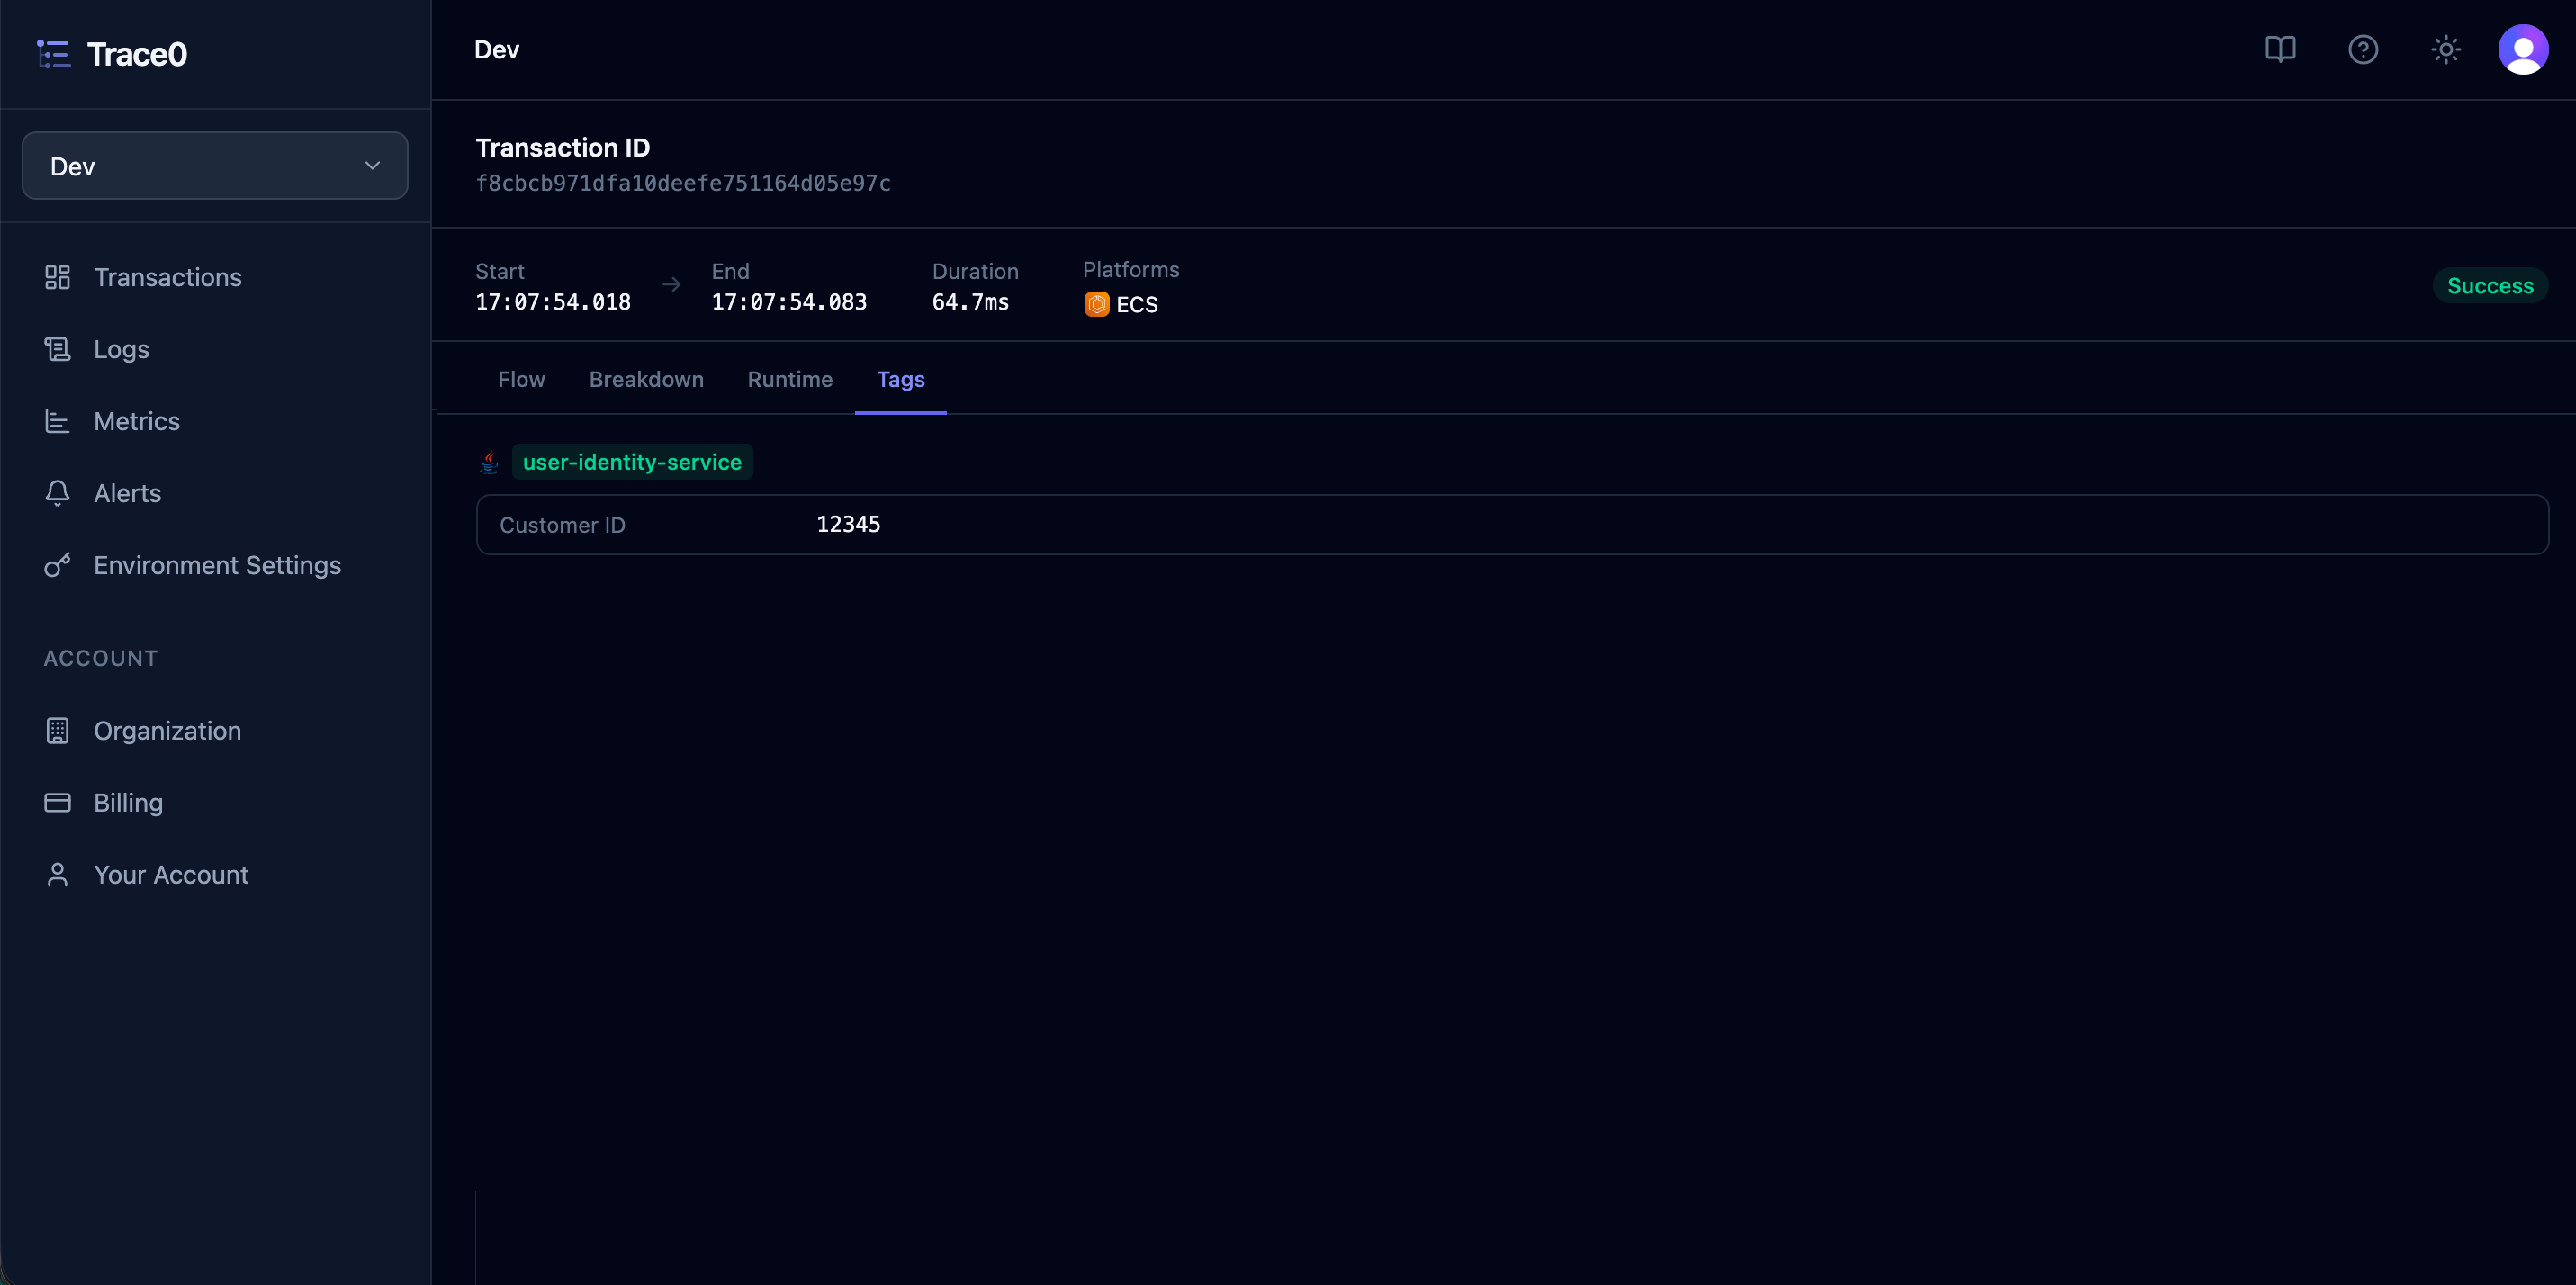
 ### Tags
Tags let you attach important business context to a transaction, such as a customer ID, order ID, tenant ID, etc.
Tags use the `trace0.tag.*` namespace and can be added through logs or span attributes.
**1. Logs**
Tags can be included in standard log messages:
```java theme={null}
log.info("Processing order trace0.tag.customer.id=12345");
```
Or as fields when using structured logging:
```json theme={null}
{
"message":"Processing order",
"trace0.tag.customer.id":"12345"
}
```
**2. Span attributes**
Tags can also be added directly as OpenTelemetry span attributes:
```java theme={null}
span.setAttribute("trace0.tag.customer.id", "12345");
```
Trace0 extracts these values and displays them as Tags on the corresponding transaction.
### Tags
Tags let you attach important business context to a transaction, such as a customer ID, order ID, tenant ID, etc.
Tags use the `trace0.tag.*` namespace and can be added through logs or span attributes.
**1. Logs**
Tags can be included in standard log messages:
```java theme={null}
log.info("Processing order trace0.tag.customer.id=12345");
```
Or as fields when using structured logging:
```json theme={null}
{
"message":"Processing order",
"trace0.tag.customer.id":"12345"
}
```
**2. Span attributes**
Tags can also be added directly as OpenTelemetry span attributes:
```java theme={null}
span.setAttribute("trace0.tag.customer.id", "12345");
```
Trace0 extracts these values and displays them as Tags on the corresponding transaction.
 ### Asynchronous Transactions
Asynchronous transactions are transactions triggered independently of the transaction that originally initiated them — for example, a Lambda function reading messages from an SQS queue, or an ECS task consuming messages from a Kafka topic.
Unlike a typical synchronous call (e.g. an HTTP request), these transactions aren't a direct extension of the transaction that triggered them. This creates two challenges for standard trace visualization:
1. **Duration doesn't roll up naturally.** It wouldn't make sense to include the duration of a downstream transaction (e.g. an SQS consumer) as part of the duration of the transaction that produced the message (e.g. the producer Lambda) — the two run independently, often at completely different times.
2. **A single transaction can have multiple sources.** A consumer might process a batch of several messages in one invocation, and those messages could have been sent by different upstream transactions.
For these reasons, asynchronous transactions aren't shown in the Flow section of the triggering transaction the way a normal synchronous call would be. Instead, they're linked via two dedicated sections on the Transaction screen:
* `Consumed By` — the downstream transaction(s) that consumed the message(s) this transaction sent.
* `Produced By` — the upstream transaction(s) that sent the message(s) this transaction consumed.
### Asynchronous Transactions
Asynchronous transactions are transactions triggered independently of the transaction that originally initiated them — for example, a Lambda function reading messages from an SQS queue, or an ECS task consuming messages from a Kafka topic.
Unlike a typical synchronous call (e.g. an HTTP request), these transactions aren't a direct extension of the transaction that triggered them. This creates two challenges for standard trace visualization:
1. **Duration doesn't roll up naturally.** It wouldn't make sense to include the duration of a downstream transaction (e.g. an SQS consumer) as part of the duration of the transaction that produced the message (e.g. the producer Lambda) — the two run independently, often at completely different times.
2. **A single transaction can have multiple sources.** A consumer might process a batch of several messages in one invocation, and those messages could have been sent by different upstream transactions.
For these reasons, asynchronous transactions aren't shown in the Flow section of the triggering transaction the way a normal synchronous call would be. Instead, they're linked via two dedicated sections on the Transaction screen:
* `Consumed By` — the downstream transaction(s) that consumed the message(s) this transaction sent.
* `Produced By` — the upstream transaction(s) that sent the message(s) this transaction consumed.
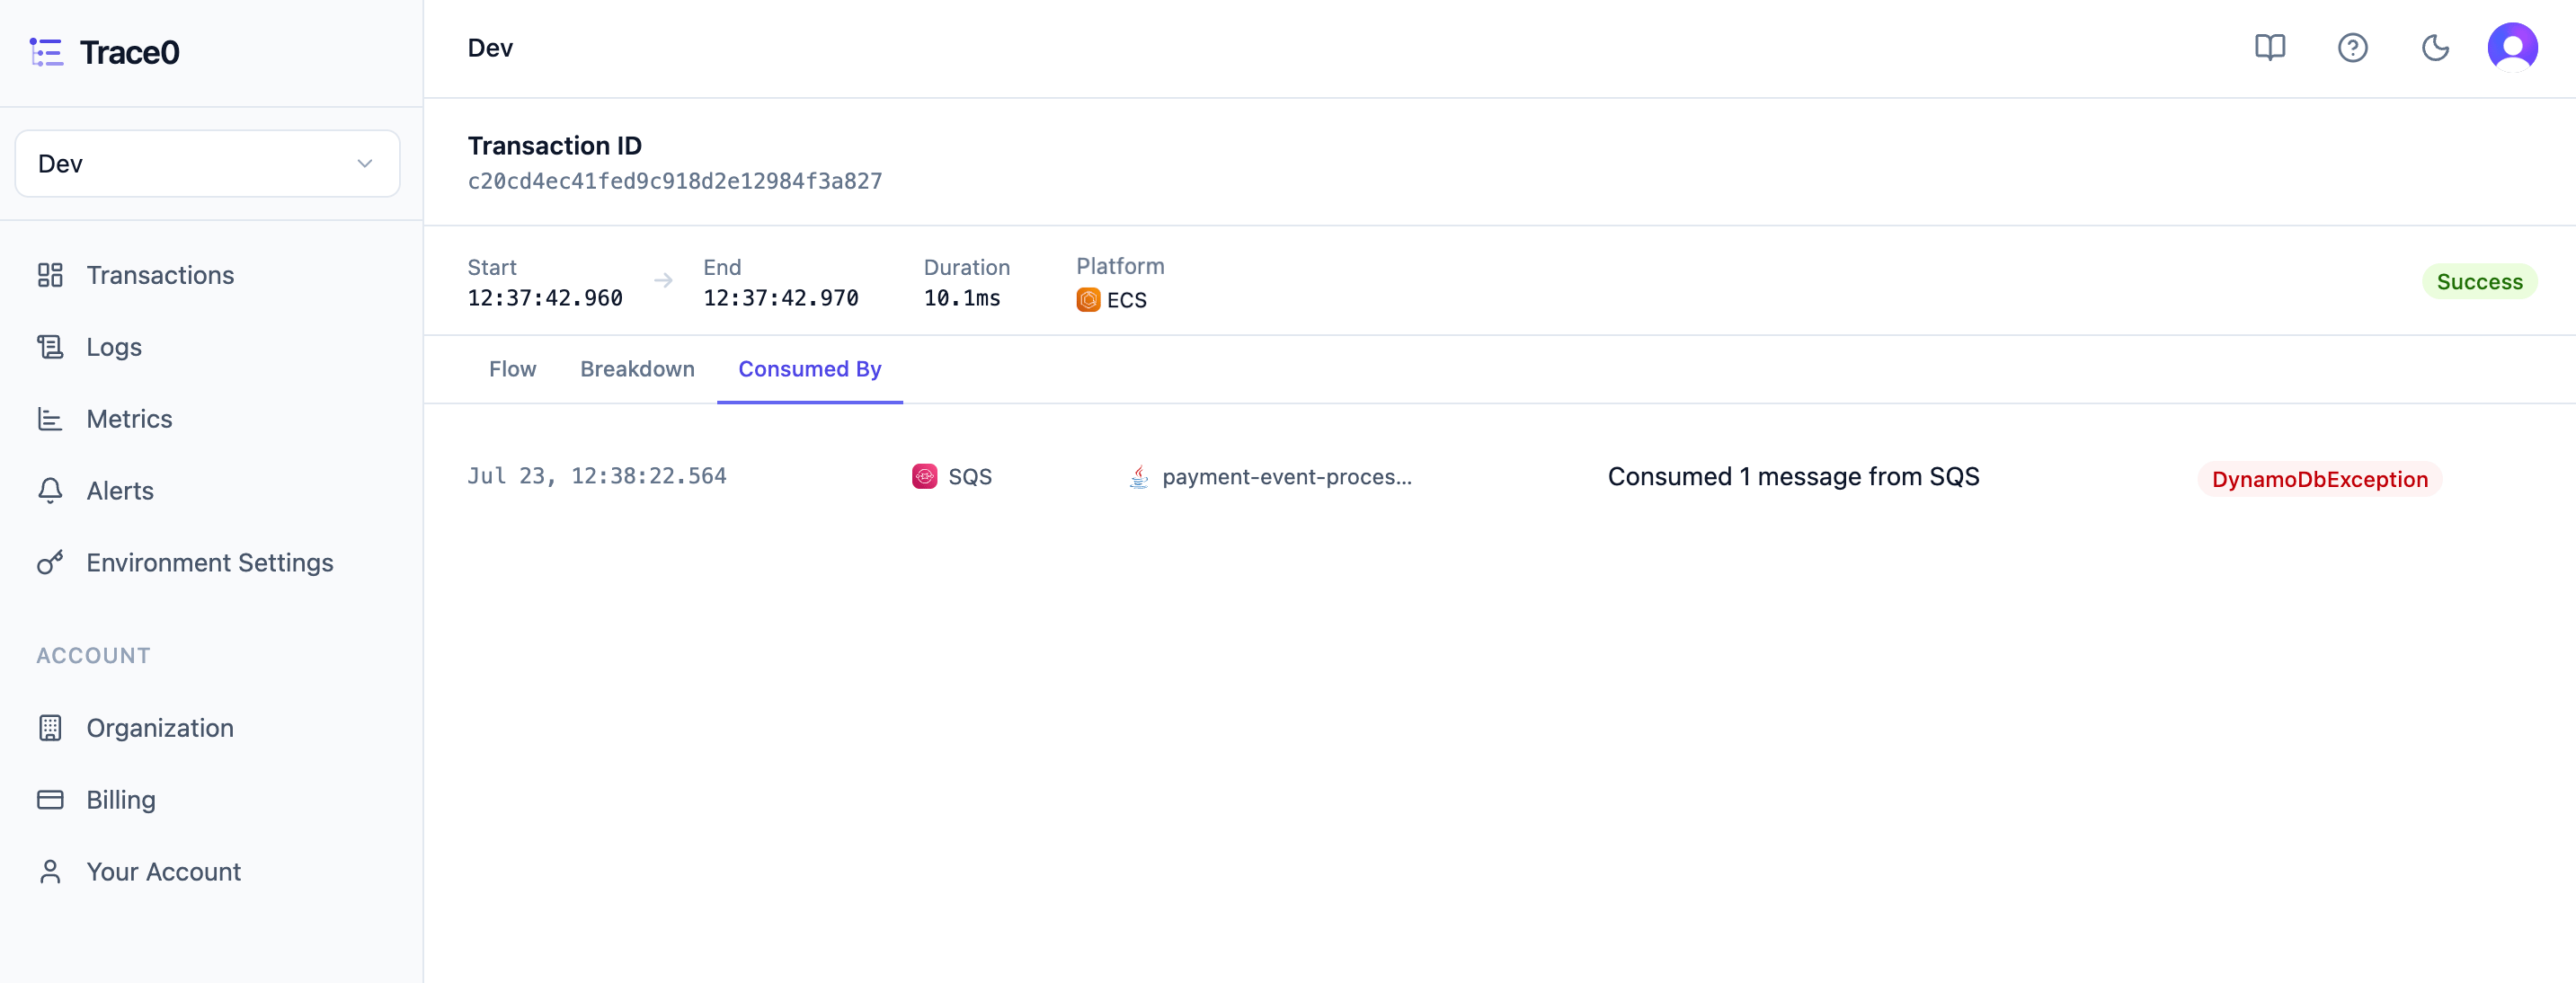
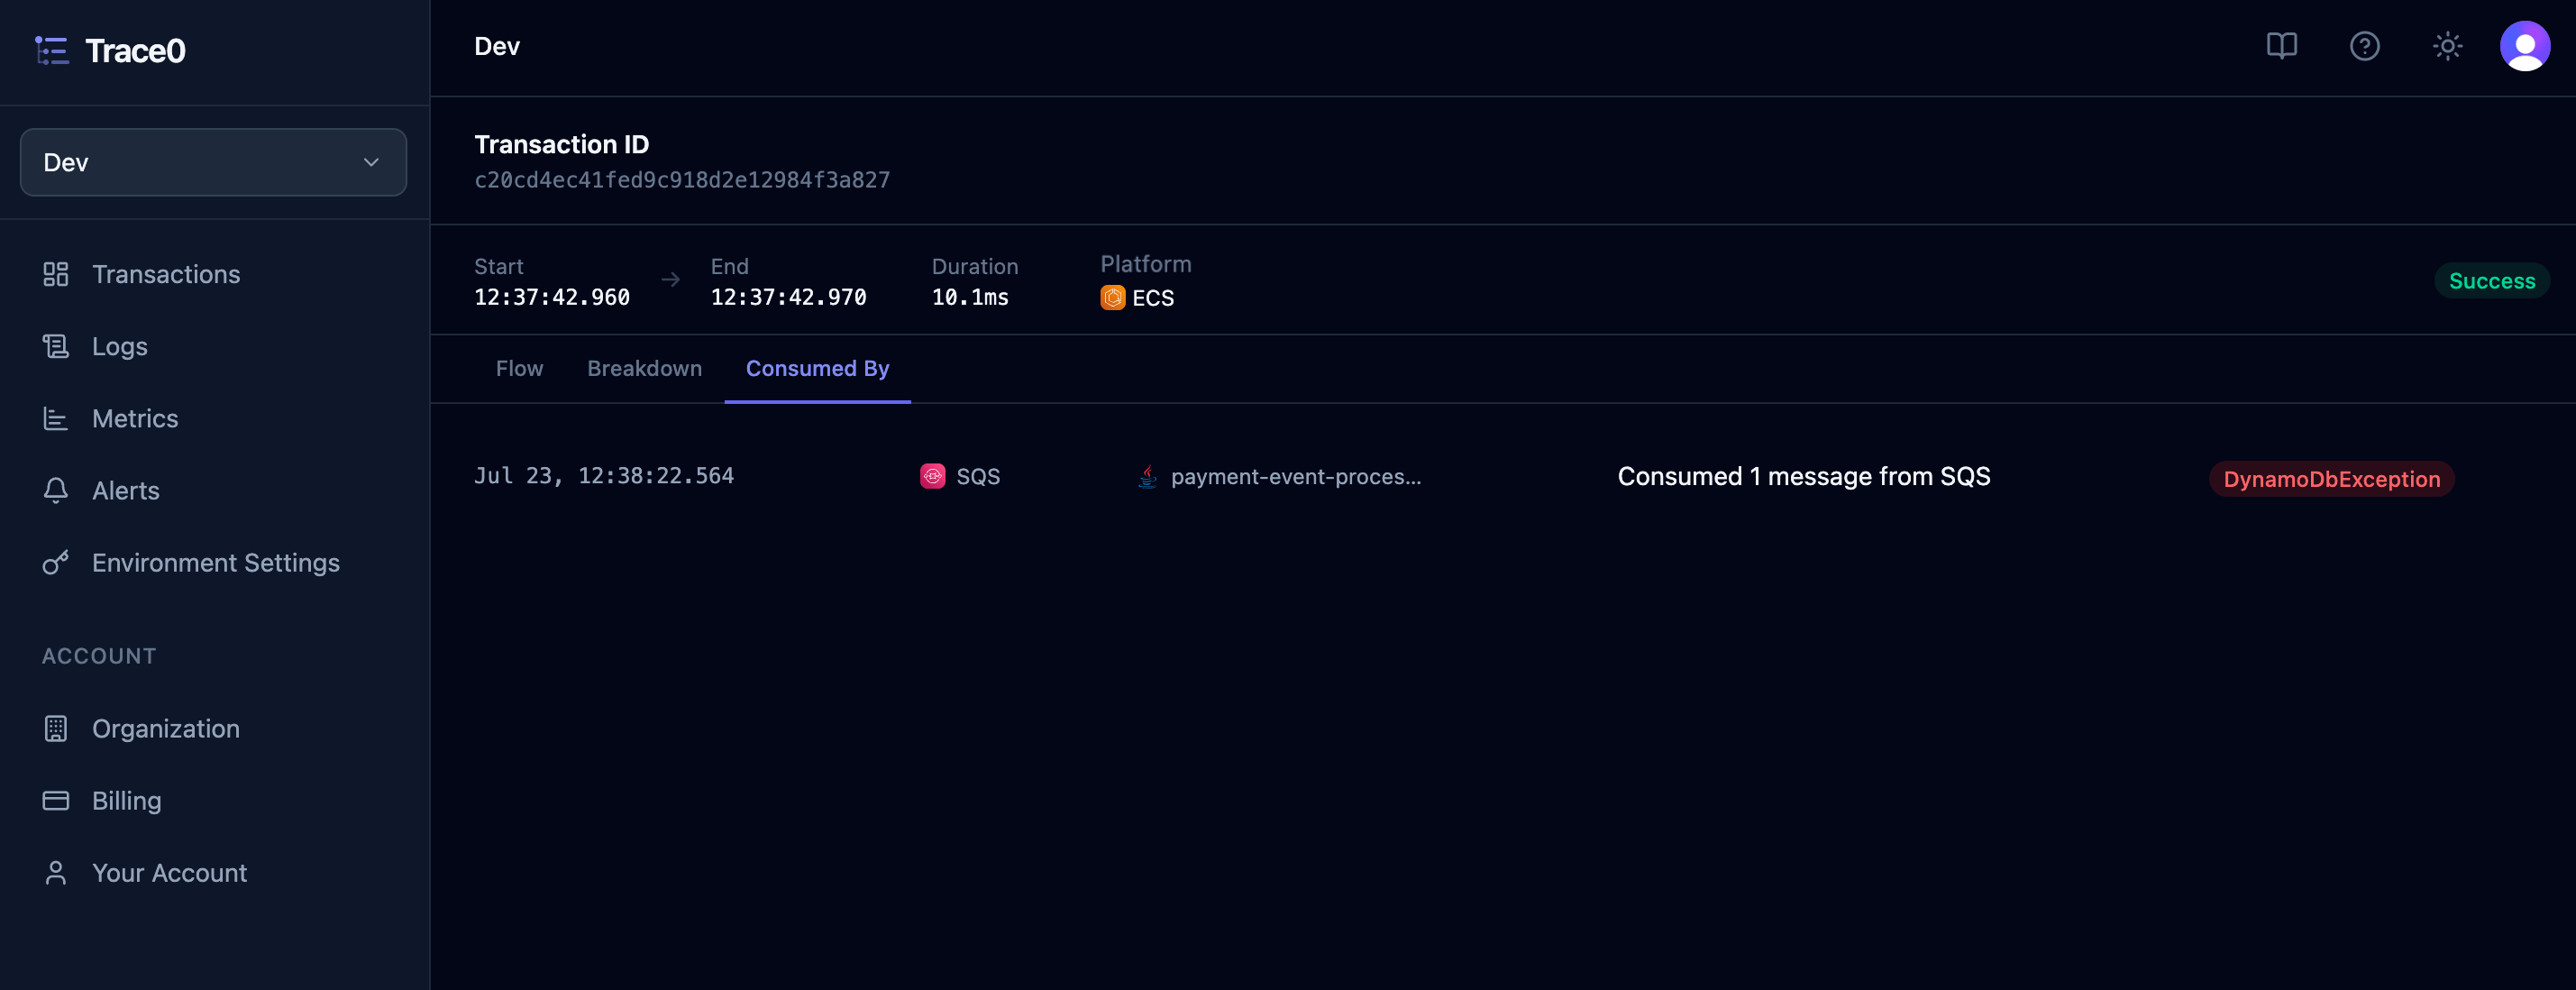
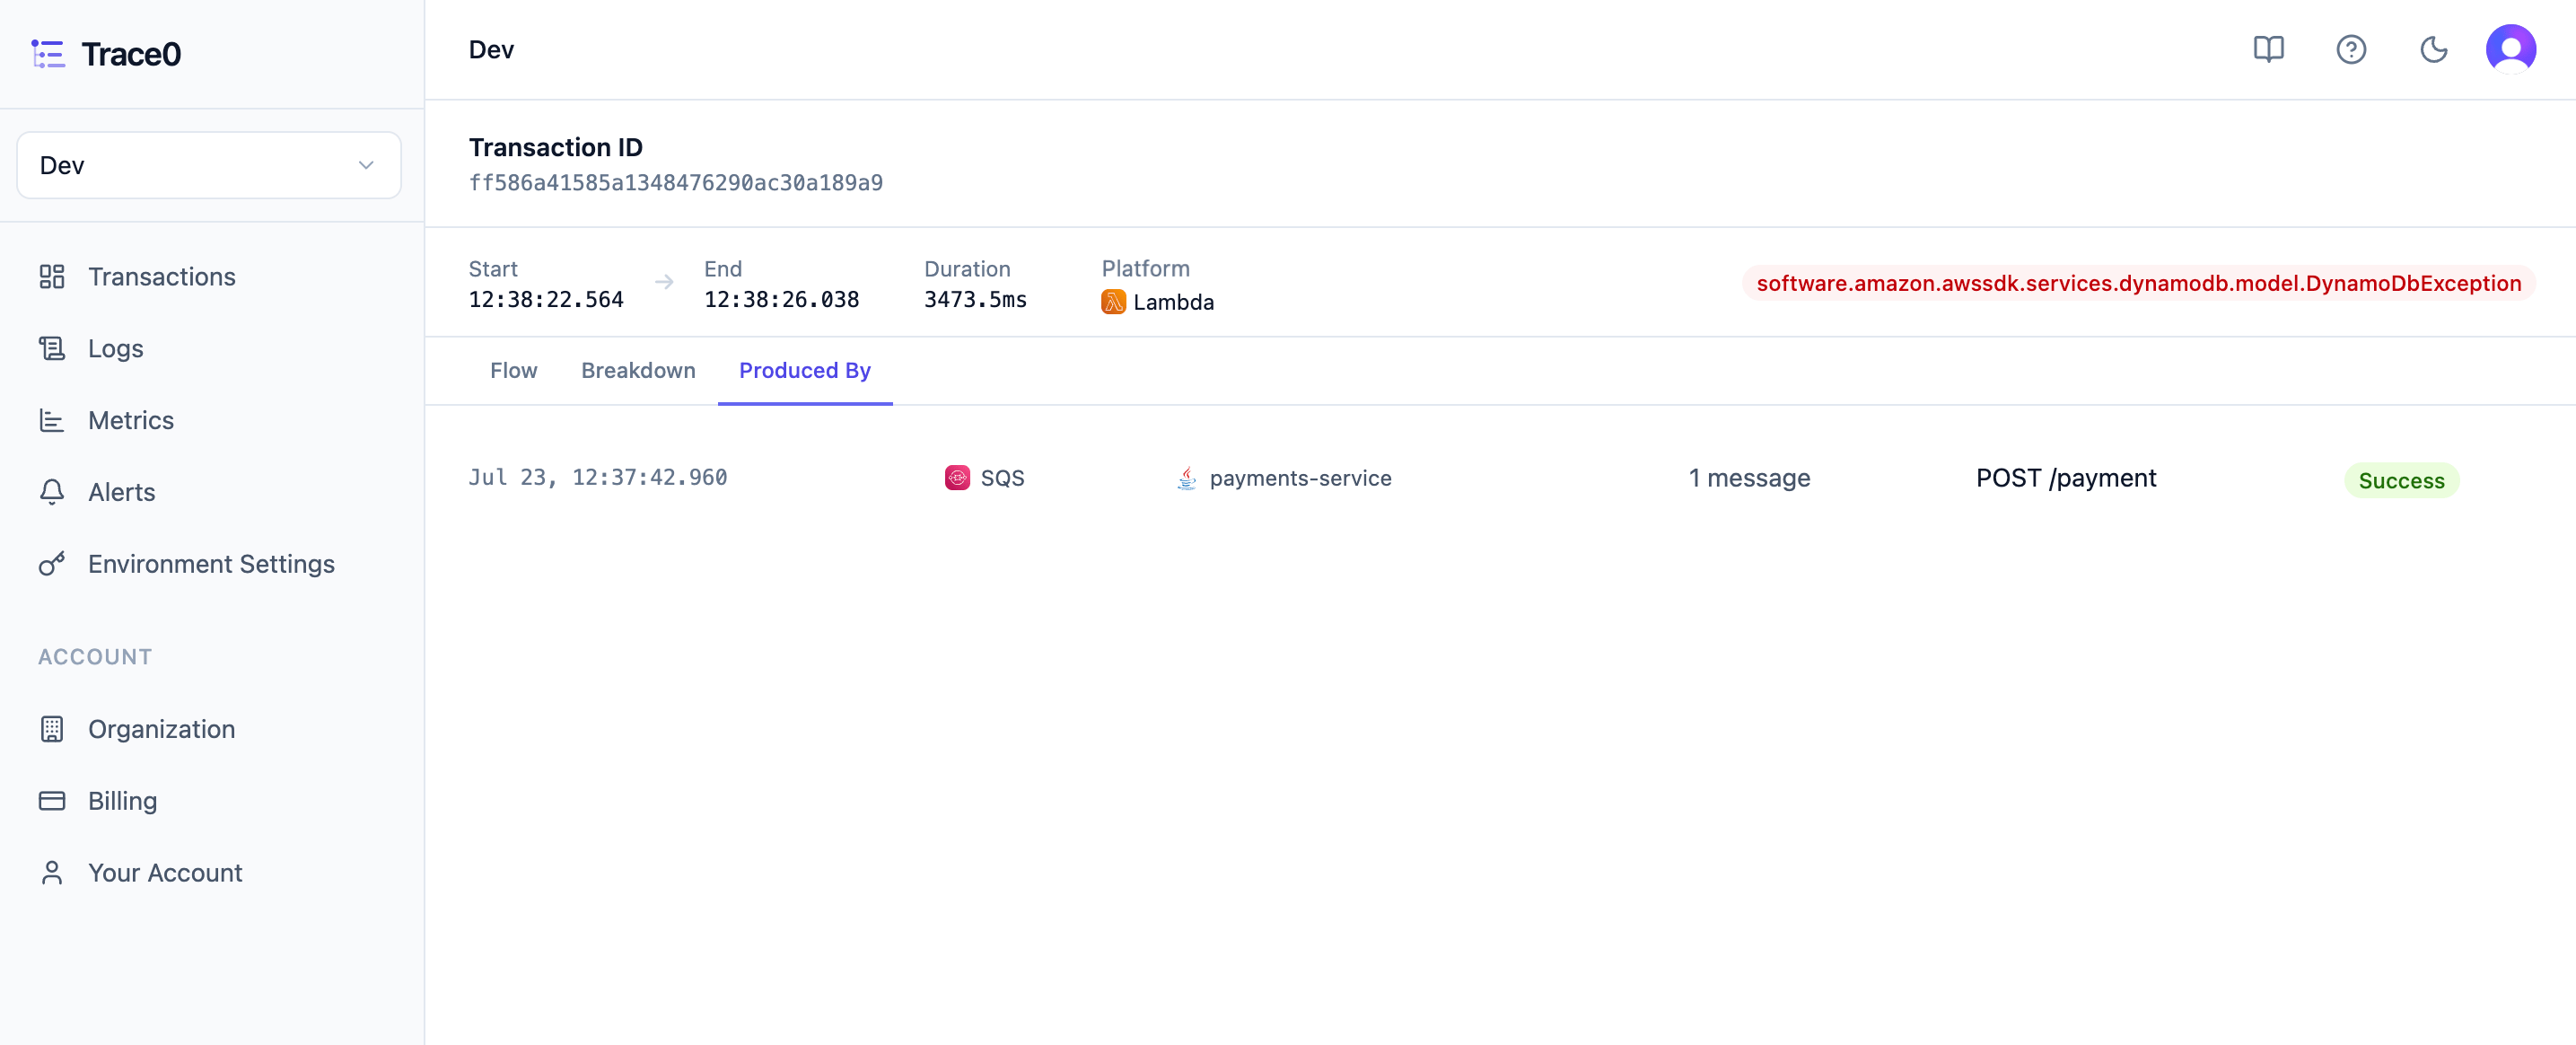
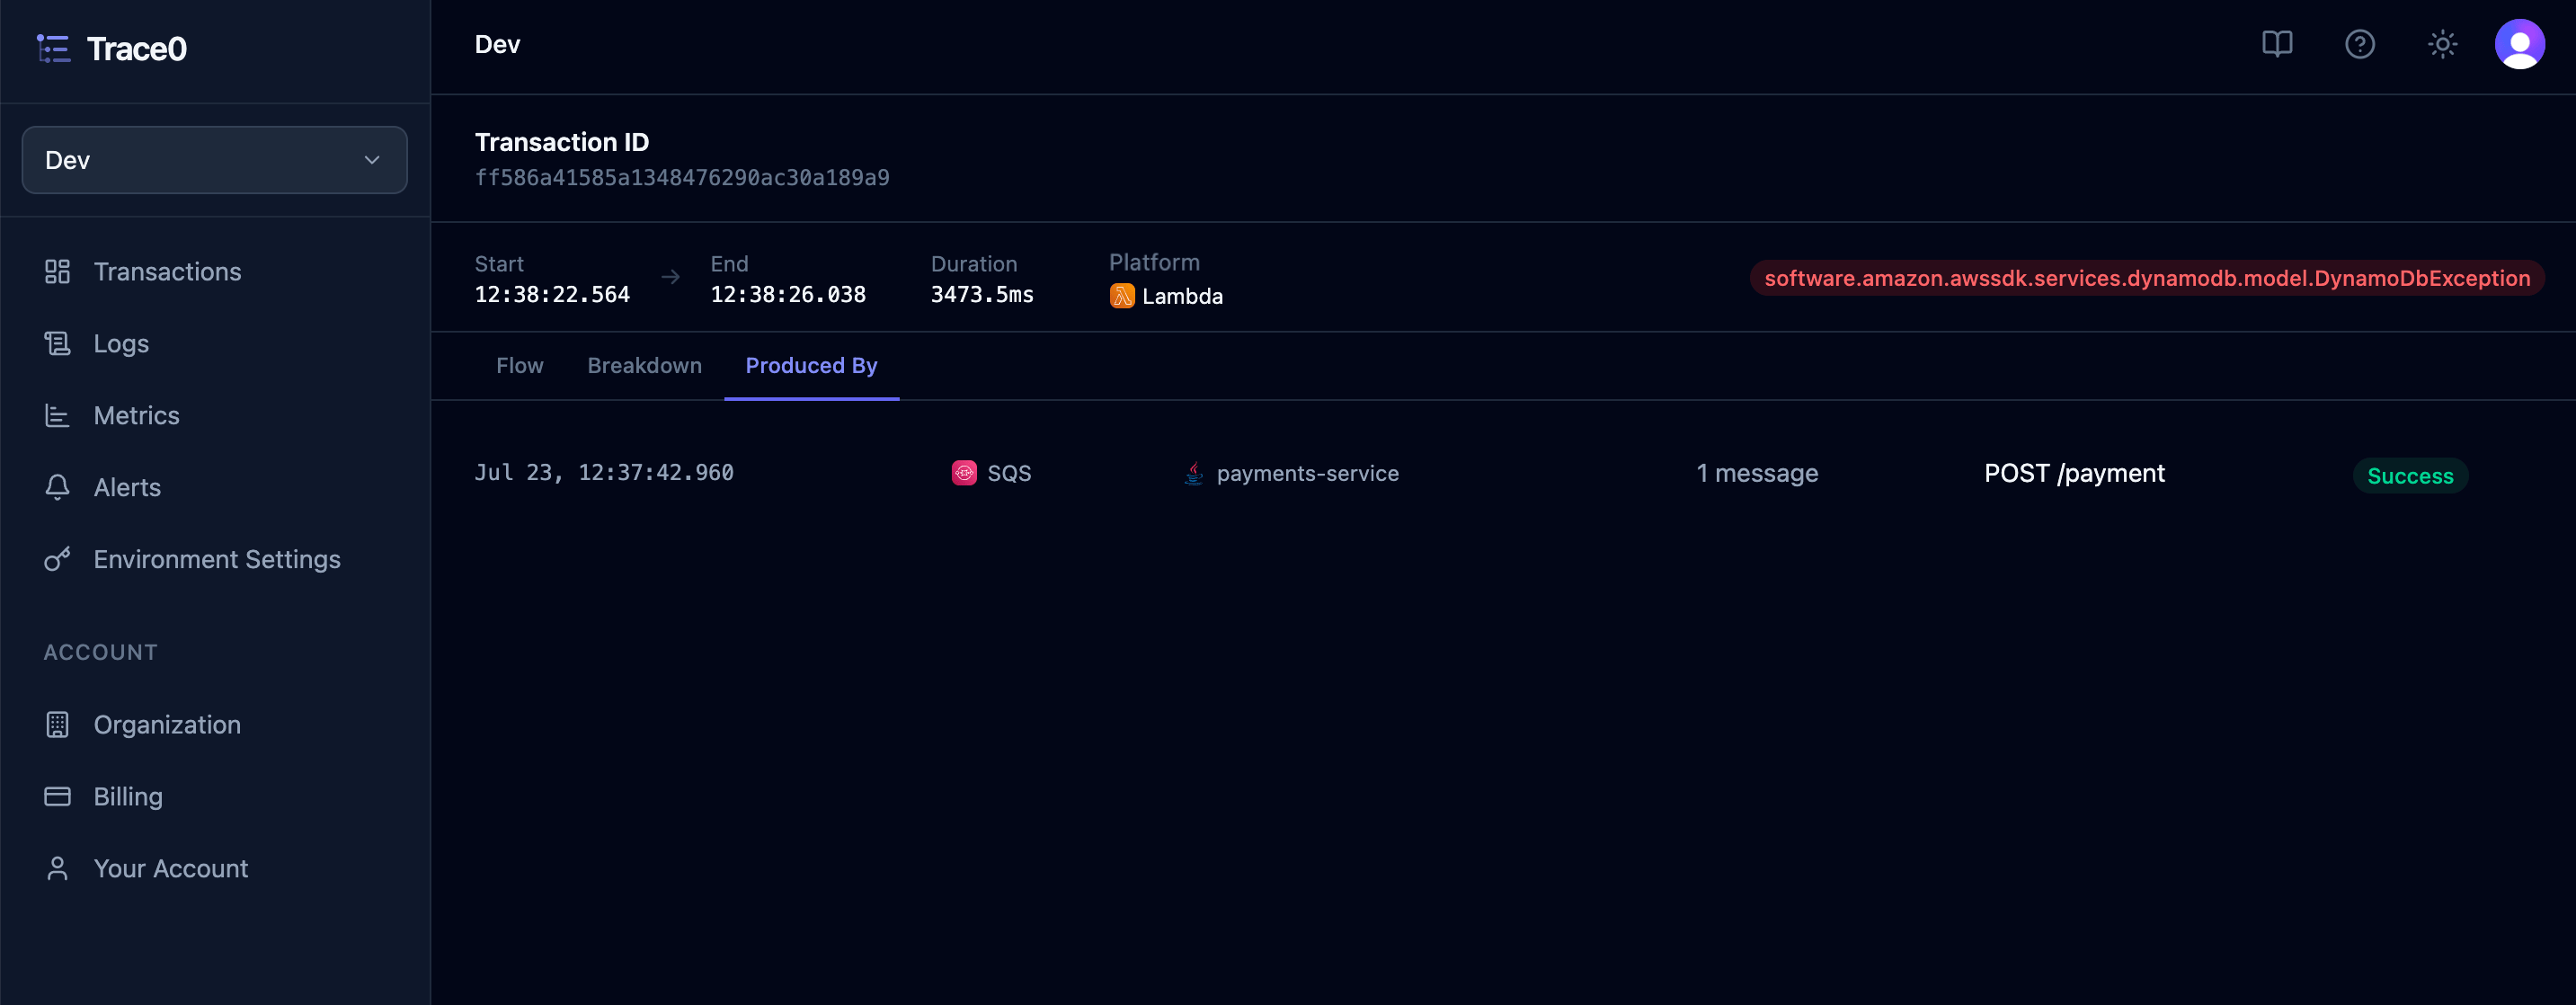 Each entry includes the transaction summary and a link to the detailed view for that transaction, so you can navigate between them directly. This makes it easy to answer questions such as:
* Did any of my downstream async services fail?
* Which transaction sent the message that triggered this one?
Each entry includes the transaction summary and a link to the detailed view for that transaction, so you can navigate between them directly. This makes it easy to answer questions such as:
* Did any of my downstream async services fail?
* Which transaction sent the message that triggered this one?