> ## Documentation Index
> Fetch the complete documentation index at: https://docs.trace0hq.com/llms.txt
> Use this file to discover all available pages before exploring further.
# Database Metrics
> Monitor database metrics including latency, error rates, and usage per table & operation.
Trace0 provides detailed metrics for each of your database systems.
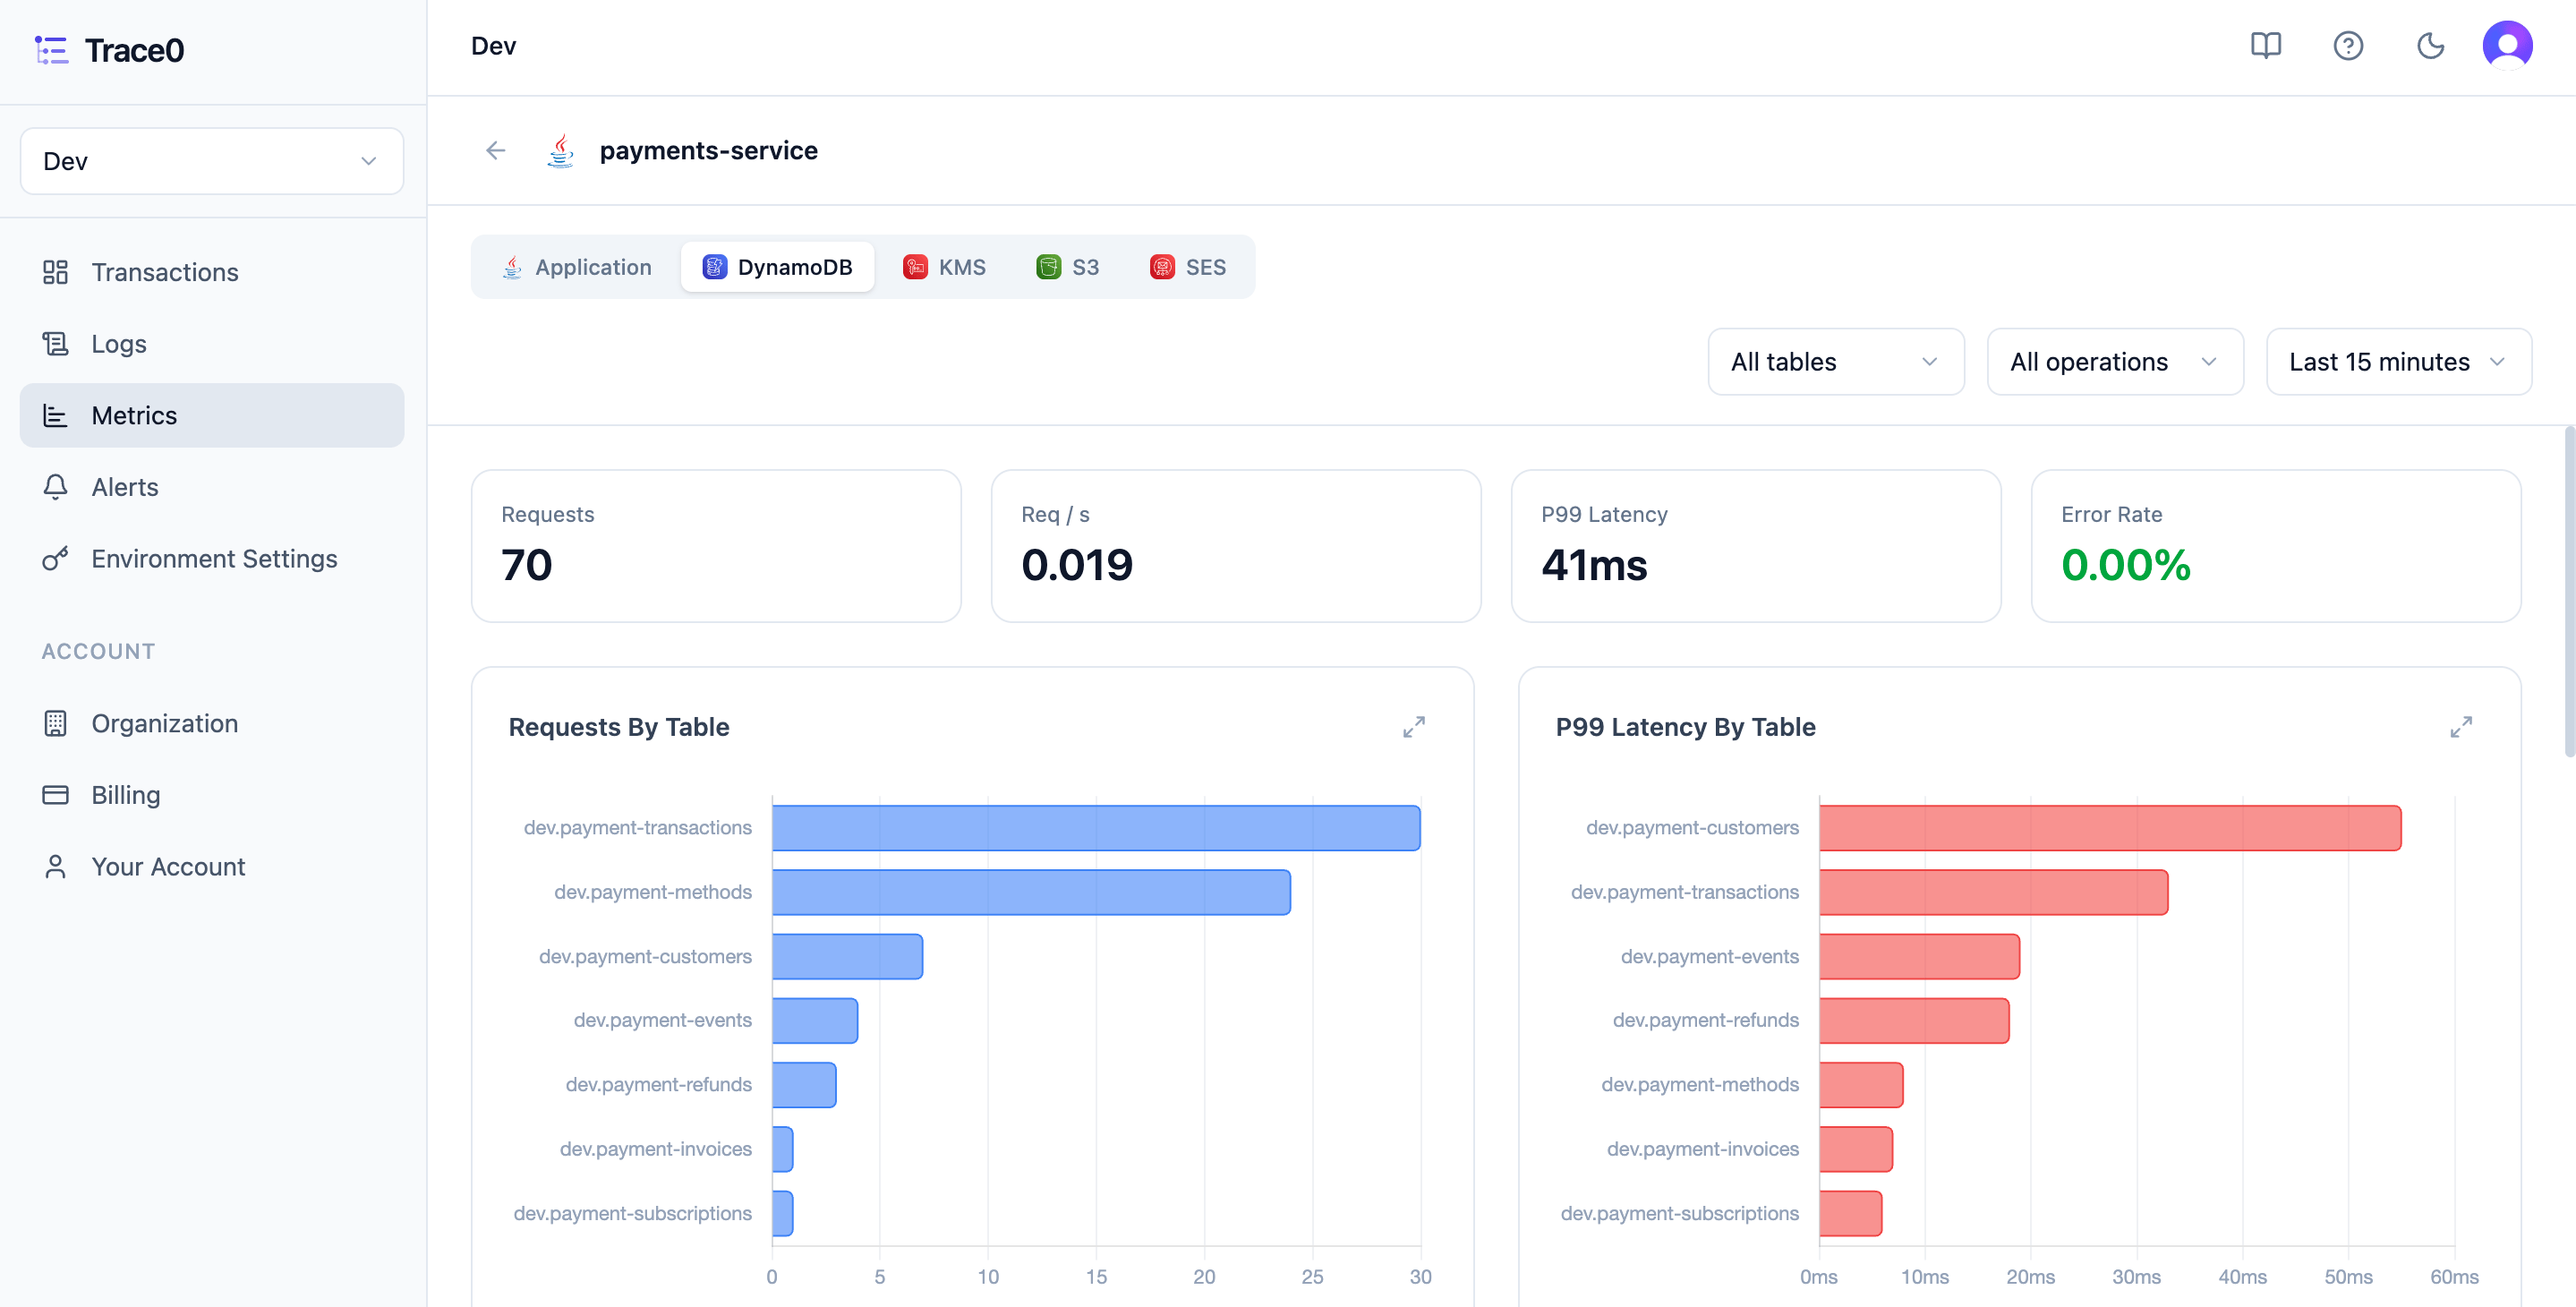
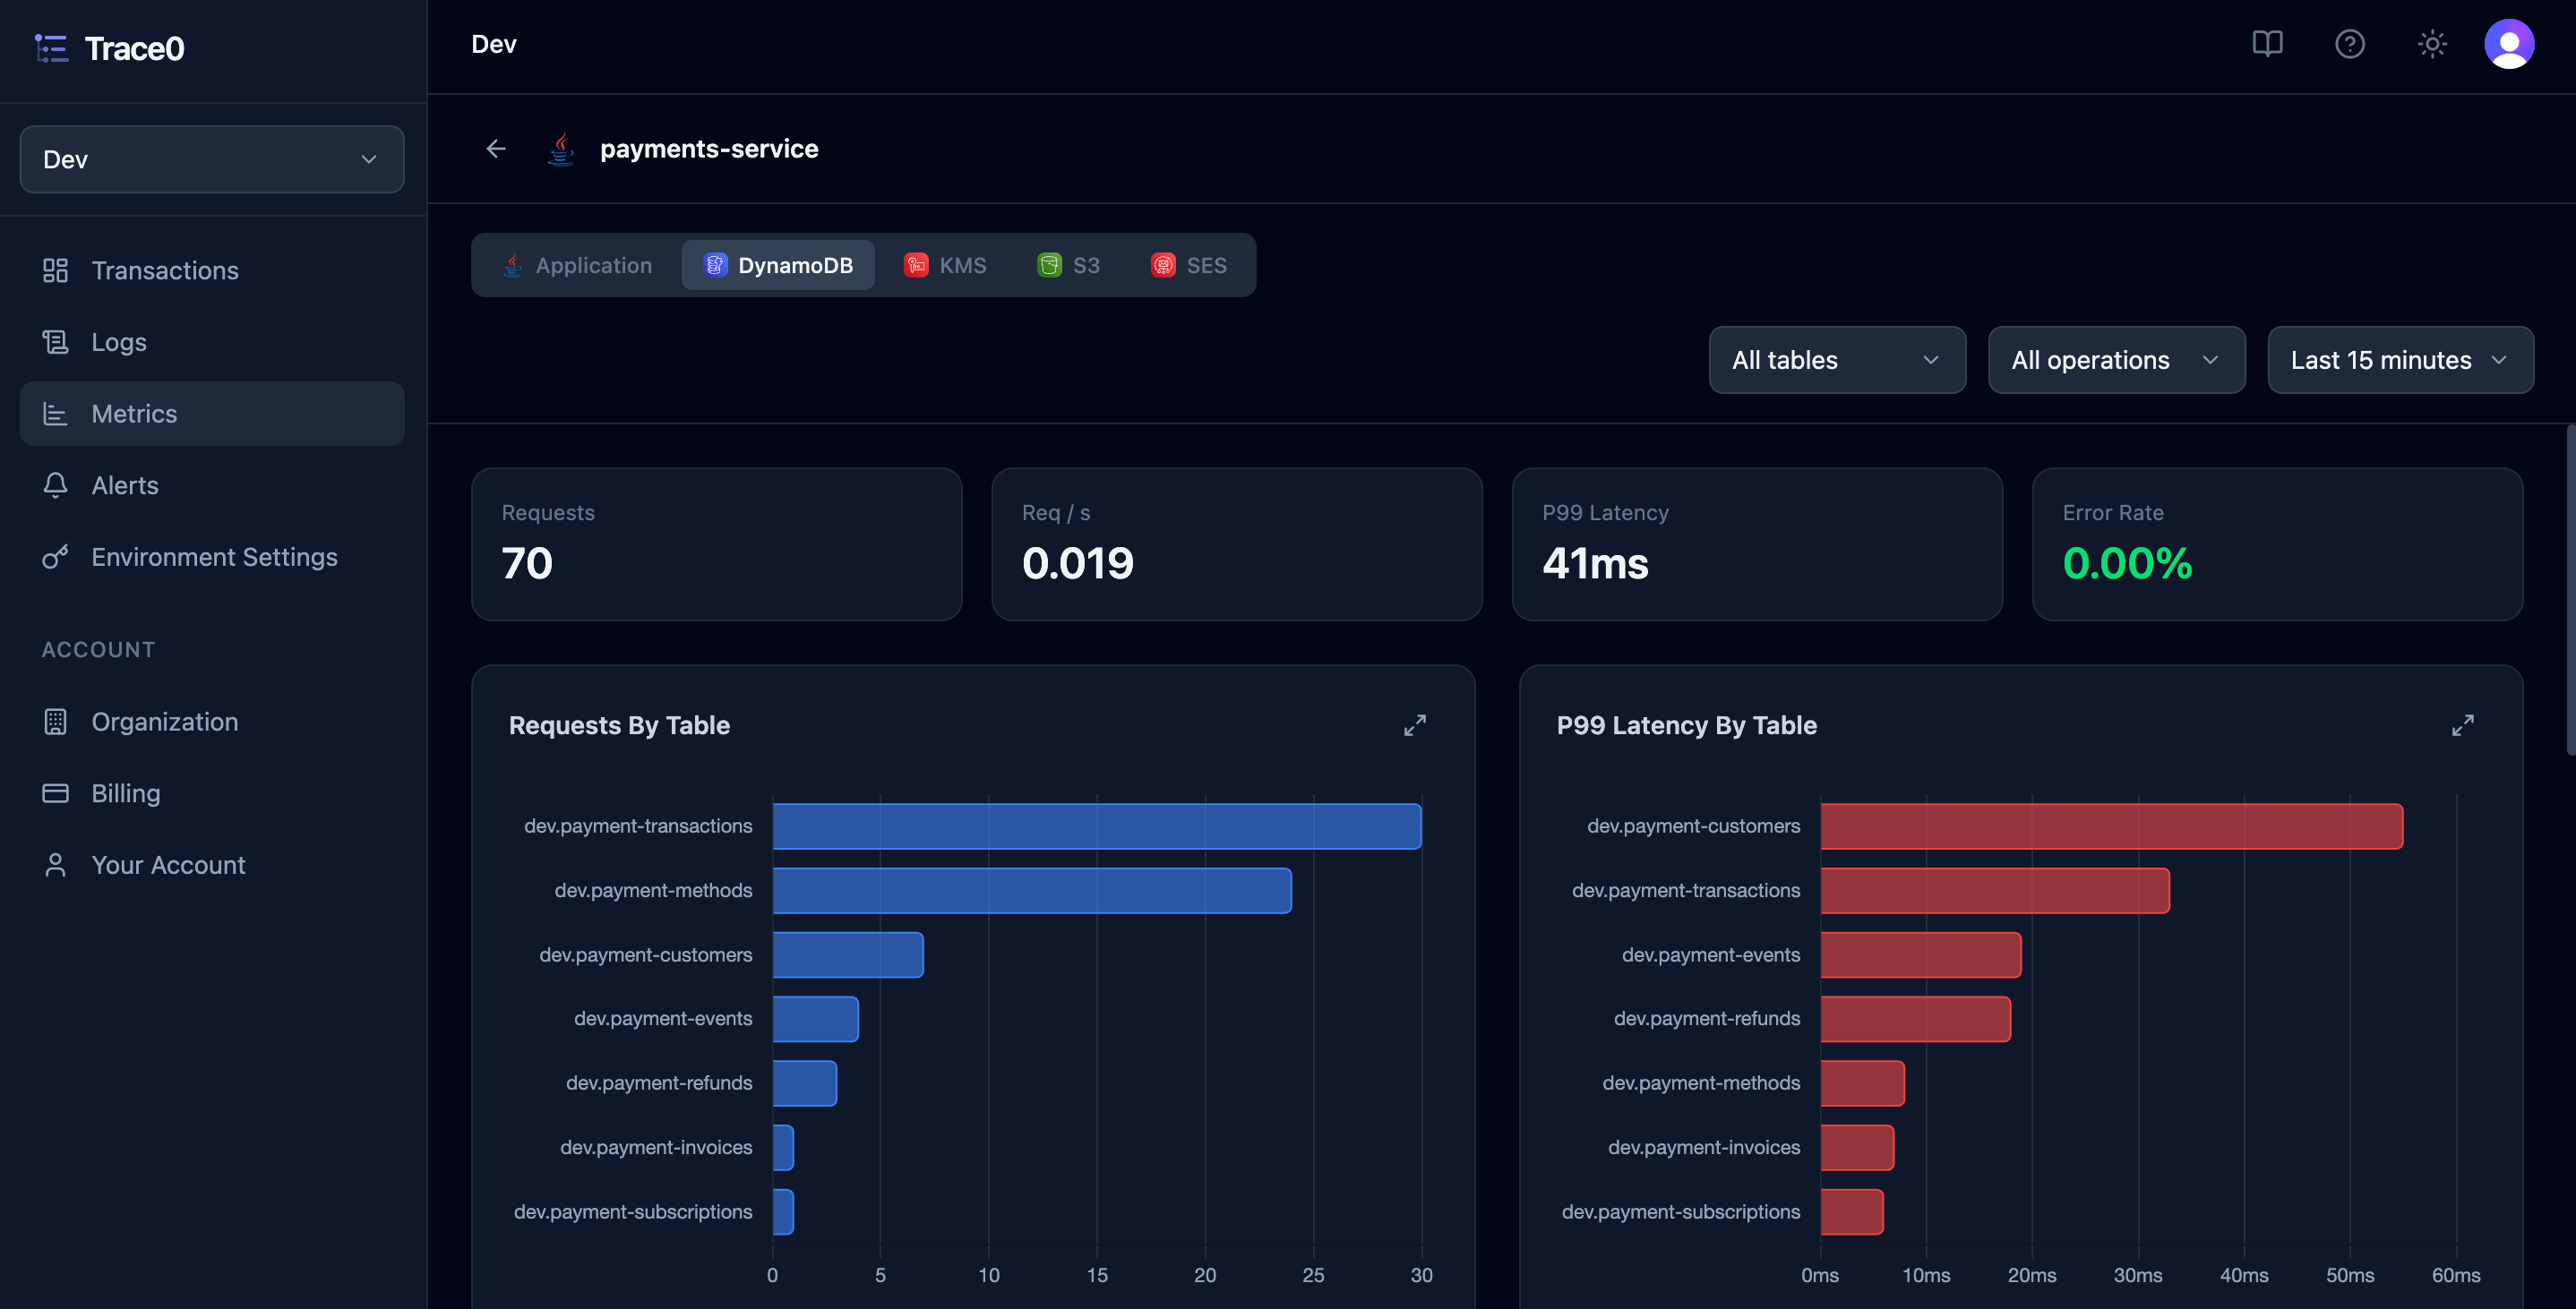
To view database metrics for a service, click into the [Metrics](https://app.trace0hq.com/metrics) section, click the `View more` link for your service, then click one of the database options from the toggle.
The toggle will be populated based on the database system(s) your service uses. In the example below, the service uses both `DynamoDB` and `PostgreSQL`.
 ### Displayed Metrics
We currently display the following database metrics. Metrics are displayed either as a single value or as a chart.
**Single Value**
| Metric | Unit |
| - | - |
| Request Count | Number |
| Requests per Second | Number |
| Request Latency P99 | Time (ms, s) |
| Error Rate | Percentage |
**Chart**
| Metric | Description | Chart Type |
| - | - | - |
| Request Count by Table | Number of database requests grouped by table | Horizontal Bar chart |
| P99 Latency by Table | P99 request latency grouped by table | Horizontal Bar chart |
| Request Count by Operation | Number of database requests grouped by operation | Horizontal Bar chart |
| P99 Latency by Operation | P99 request latency grouped by operation | Horizontal Bar chart |
| Request Count Over Time | Number of database requests over time | Vertical Bar chart |
| Latency Over Time | P50, P75, P90, P95, and P99 request latency over time | Line chart |
If you require other metrics to be displayed, please email [hello@trace0hq.com](mailto:hello@trace0hq.com).
### Database System Support
Trace0 provides metrics for any database system that exports its telemetry data using [OpenTelemetry database semantic conventions](https://opentelemetry.io/docs/specs/semconv/registry/attributes/db/).
This includes the following popular databases:
| | |
| - | - |
| Actian Ingres | Amazon DynamoDB |
| Amazon Redshift | Azure Cosmos DB |
| Apache Cassandra | ClickHouse |
| CockroachDB | Couchbase |
| Apache CouchDB | Apache Derby |
| Elasticsearch | Firebird |
| Google Cloud Spanner | Apache Geode |
| H2 Database | Apache HBase |
| Apache Hive | HyperSQL Database |
| IBM Db2 | IBM Informix |
| IBM Netezza | InfluxDB |
| Instant | InterSystems Caché |
| MariaDB | Memcached |
| Microsoft SQL Server | MongoDB |
| MySQL | Neo4j |
| OpenSearch | Oracle Database |
| PostgreSQL | Redis |
| SAP HANA | SAP MaxDB |
| Adabas | SQLite |
| Teradata | Trino |
This documentation is built and hosted on [Mintlify](https://mintlify.com), a developer documentation platform.
### Displayed Metrics
We currently display the following database metrics. Metrics are displayed either as a single value or as a chart.
**Single Value**
| Metric | Unit |
| - | - |
| Request Count | Number |
| Requests per Second | Number |
| Request Latency P99 | Time (ms, s) |
| Error Rate | Percentage |
**Chart**
| Metric | Description | Chart Type |
| - | - | - |
| Request Count by Table | Number of database requests grouped by table | Horizontal Bar chart |
| P99 Latency by Table | P99 request latency grouped by table | Horizontal Bar chart |
| Request Count by Operation | Number of database requests grouped by operation | Horizontal Bar chart |
| P99 Latency by Operation | P99 request latency grouped by operation | Horizontal Bar chart |
| Request Count Over Time | Number of database requests over time | Vertical Bar chart |
| Latency Over Time | P50, P75, P90, P95, and P99 request latency over time | Line chart |
If you require other metrics to be displayed, please email [hello@trace0hq.com](mailto:hello@trace0hq.com).
### Database System Support
Trace0 provides metrics for any database system that exports its telemetry data using [OpenTelemetry database semantic conventions](https://opentelemetry.io/docs/specs/semconv/registry/attributes/db/).
This includes the following popular databases:
| | |
| - | - |
| Actian Ingres | Amazon DynamoDB |
| Amazon Redshift | Azure Cosmos DB |
| Apache Cassandra | ClickHouse |
| CockroachDB | Couchbase |
| Apache CouchDB | Apache Derby |
| Elasticsearch | Firebird |
| Google Cloud Spanner | Apache Geode |
| H2 Database | Apache HBase |
| Apache Hive | HyperSQL Database |
| IBM Db2 | IBM Informix |
| IBM Netezza | InfluxDB |
| Instant | InterSystems Caché |
| MariaDB | Memcached |
| Microsoft SQL Server | MongoDB |
| MySQL | Neo4j |
| OpenSearch | Oracle Database |
| PostgreSQL | Redis |
| SAP HANA | SAP MaxDB |
| Adabas | SQLite |
| Teradata | Trino |
This documentation is built and hosted on [Mintlify](https://mintlify.com), a developer documentation platform.