> ## Documentation Index
> Fetch the complete documentation index at: https://docs.trace0hq.com/llms.txt
> Use this file to discover all available pages before exploring further.
# Alerts
> Create and manage alerts for errors and metrics thresholds.
## Setup
In Trace0, you can set alerts for both errors and metrics thresholds. To create a new alert, head to the [Alerts](https://app.trace0hq.com/alerts) section and click the `Add New Alert` button:
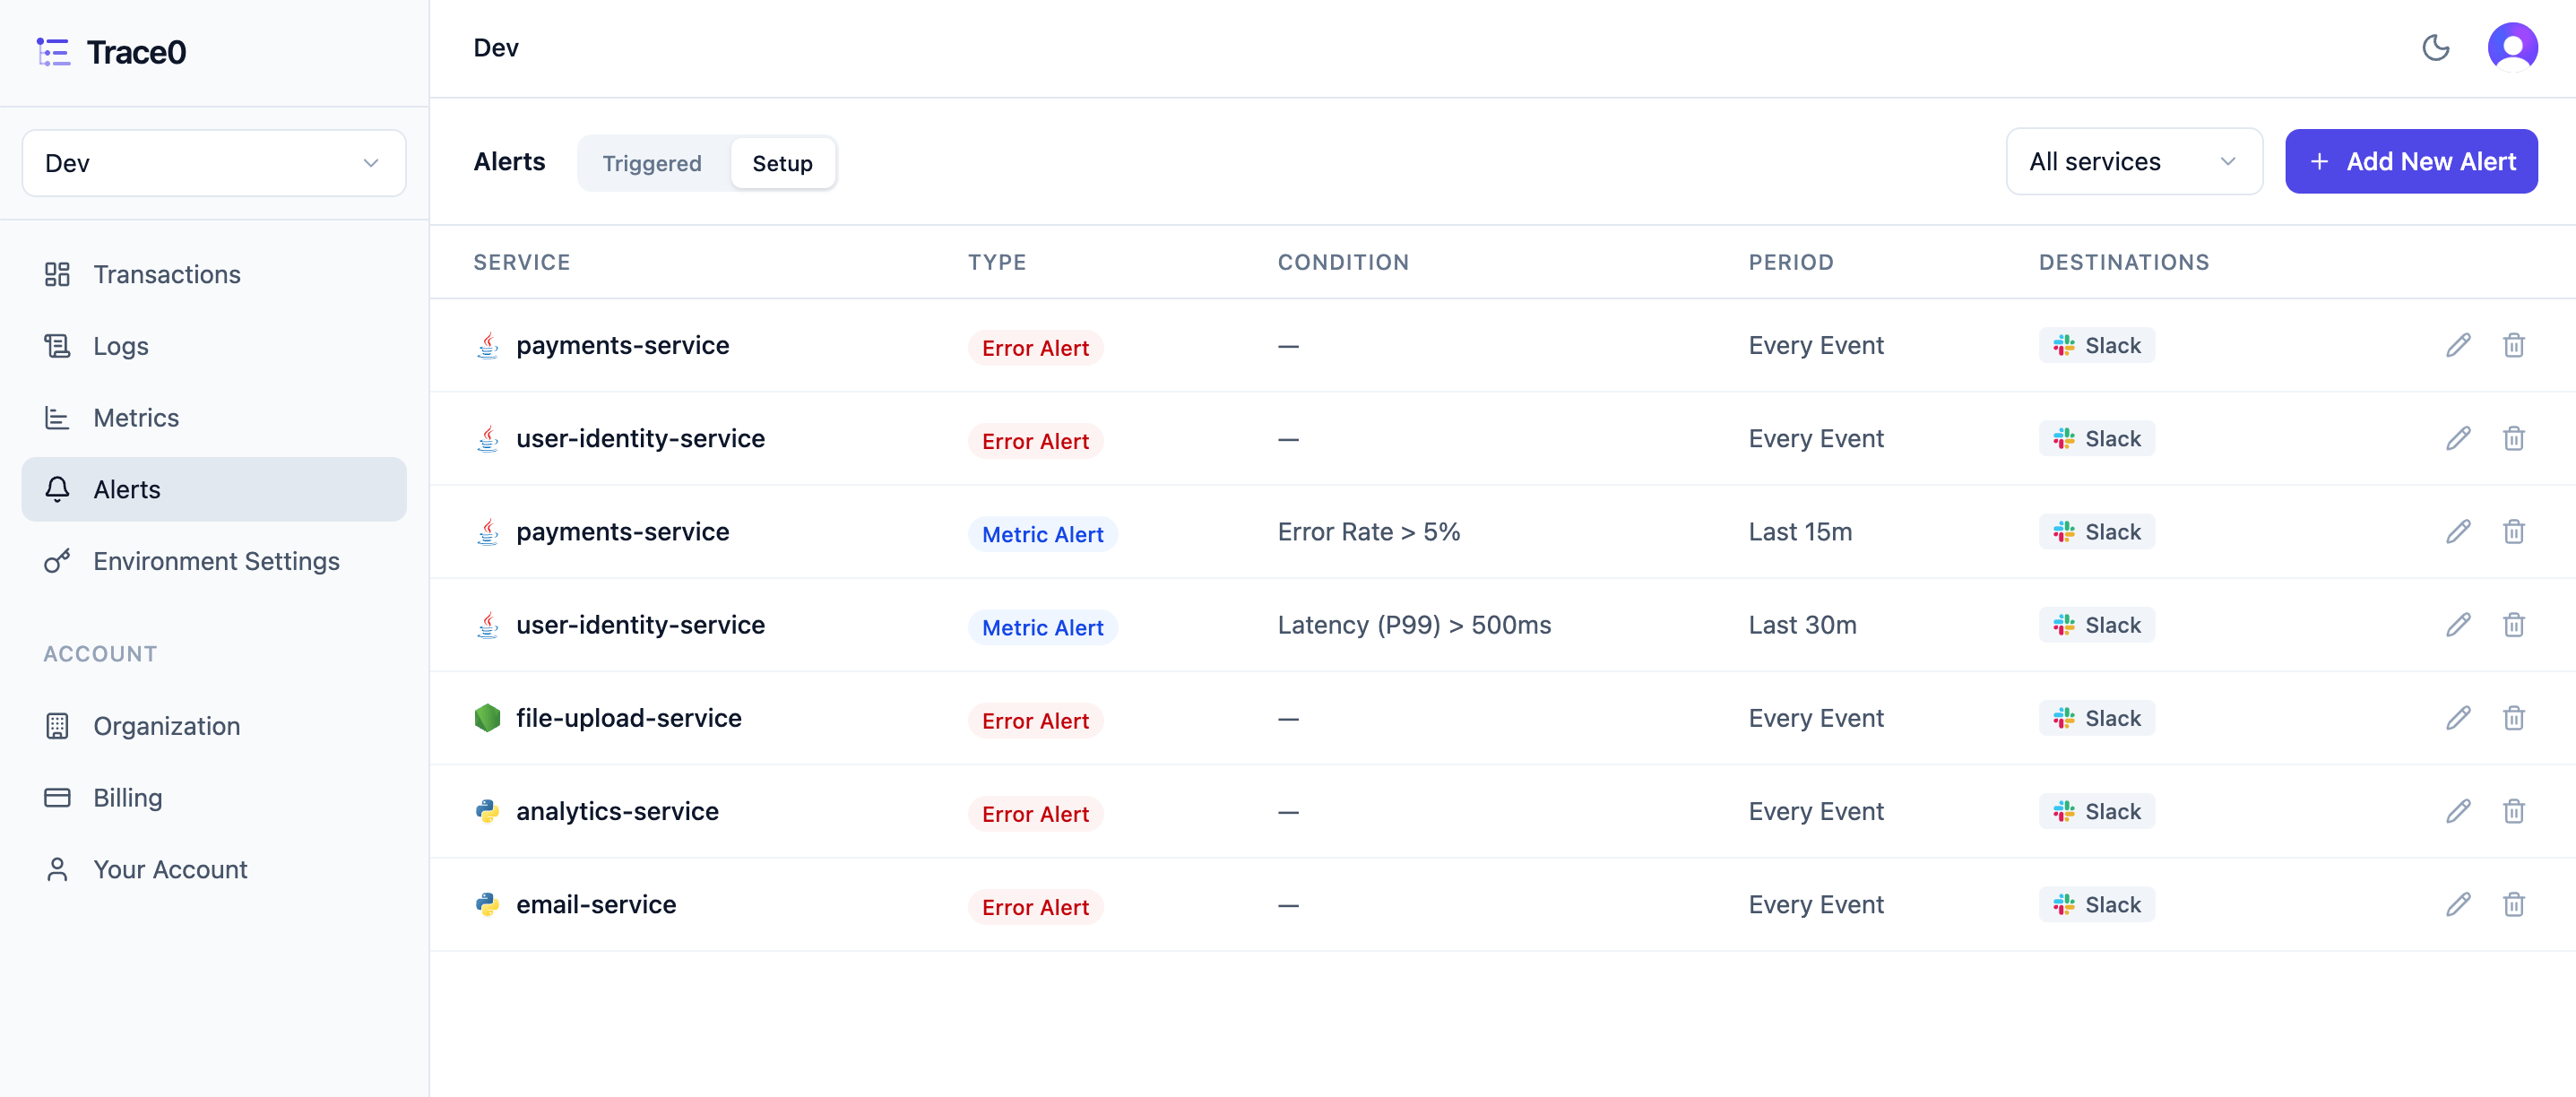
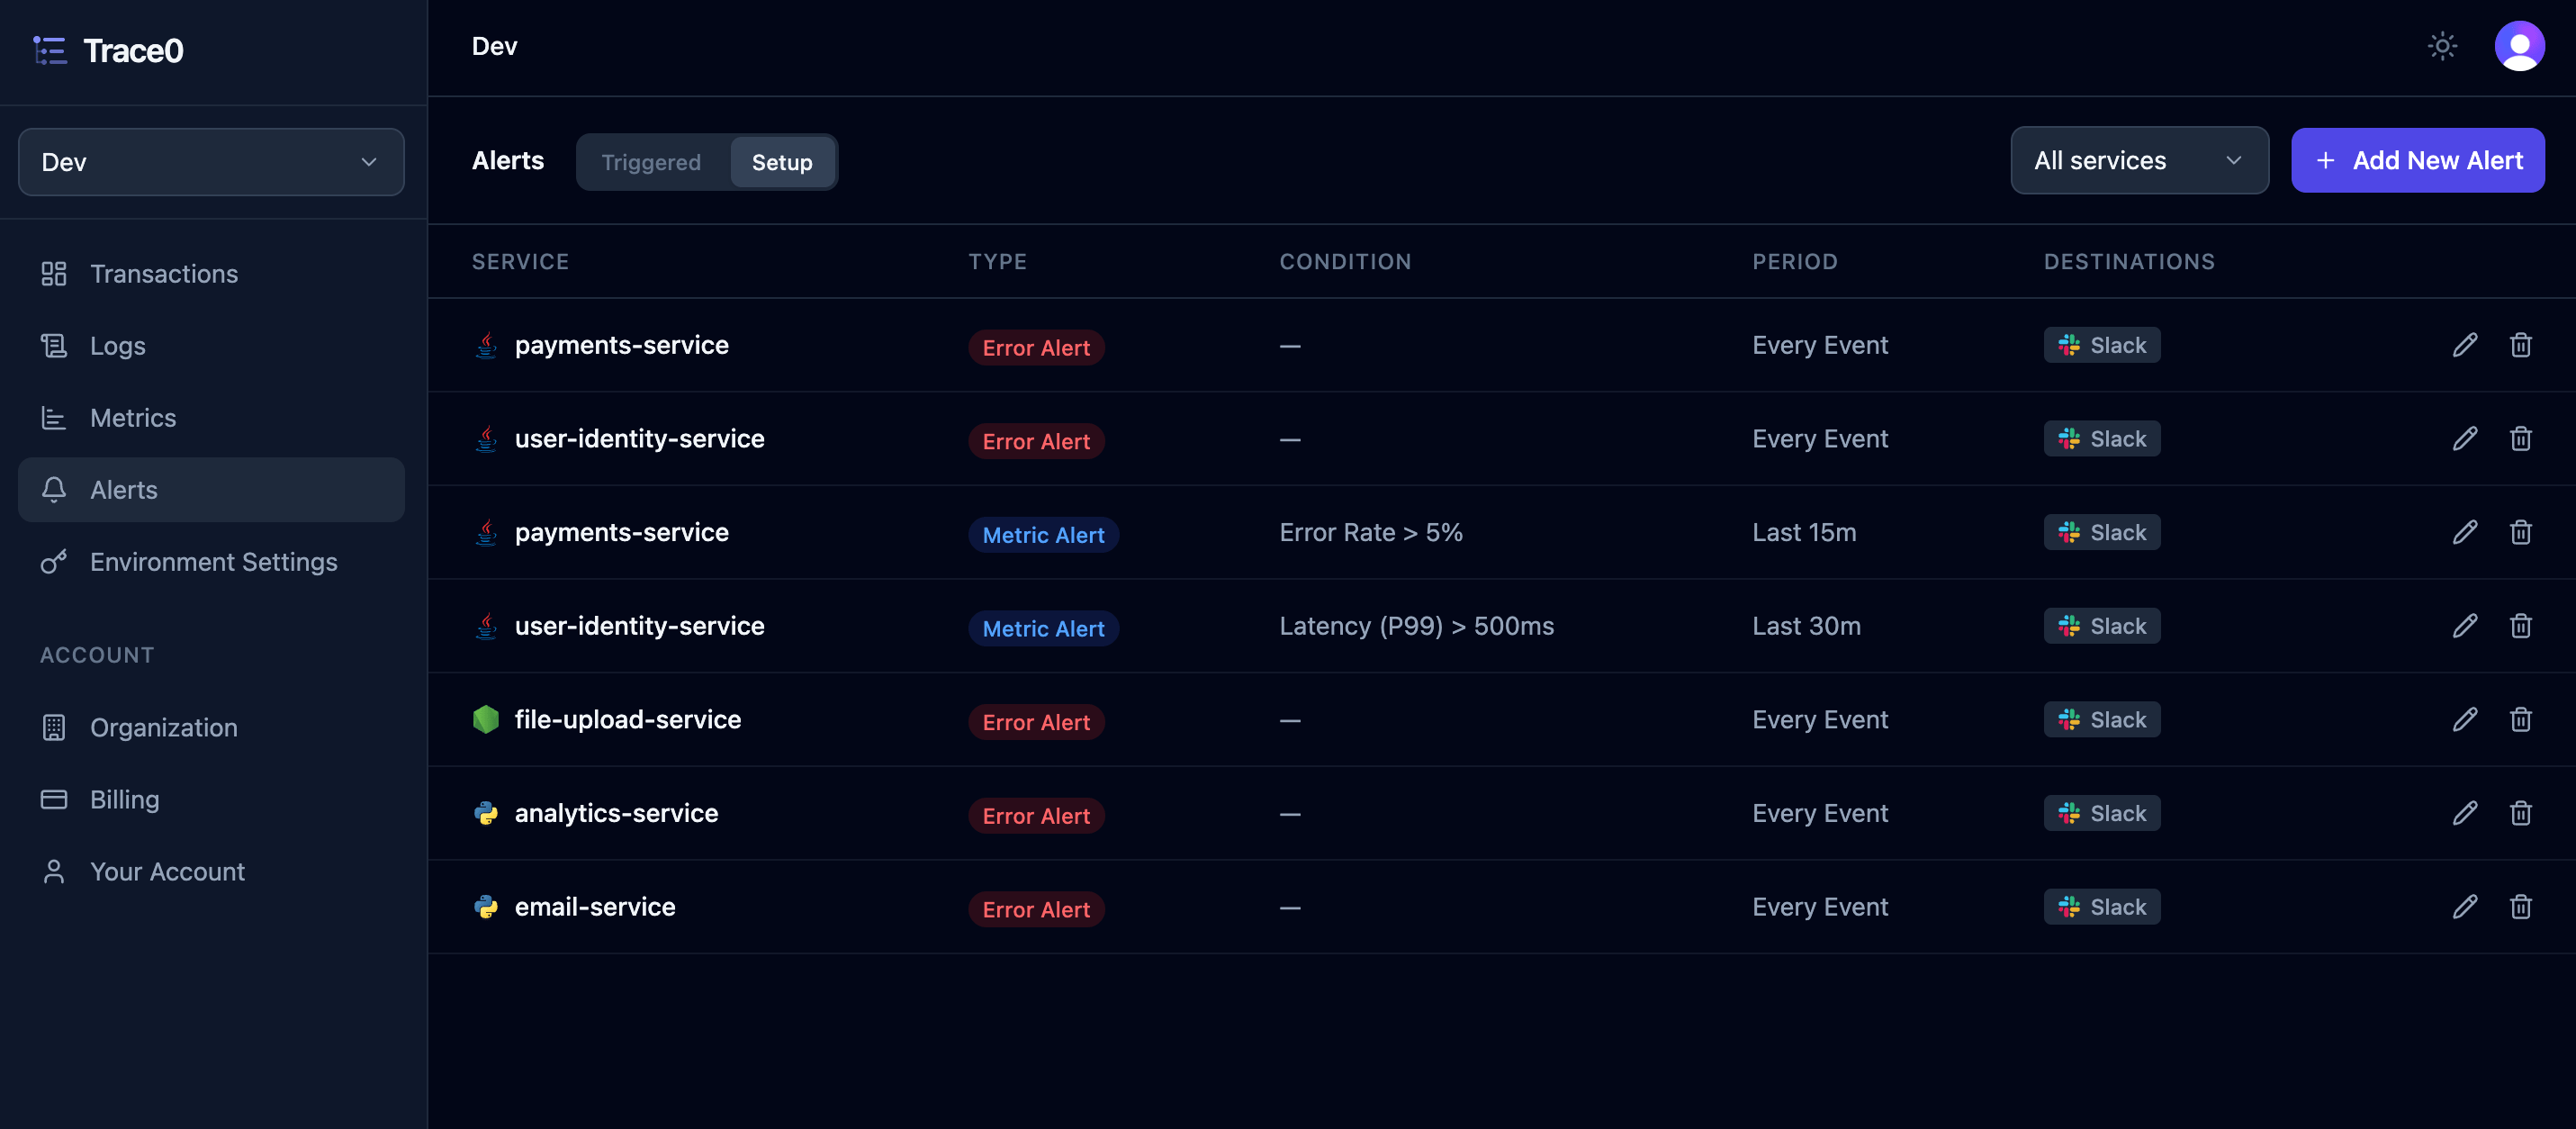 You can then select the service the alert applies to, then choose an alert type — [Error Alert](#error-alerts) or [Metric Alert](#metric-alerts).
### Error Alerts
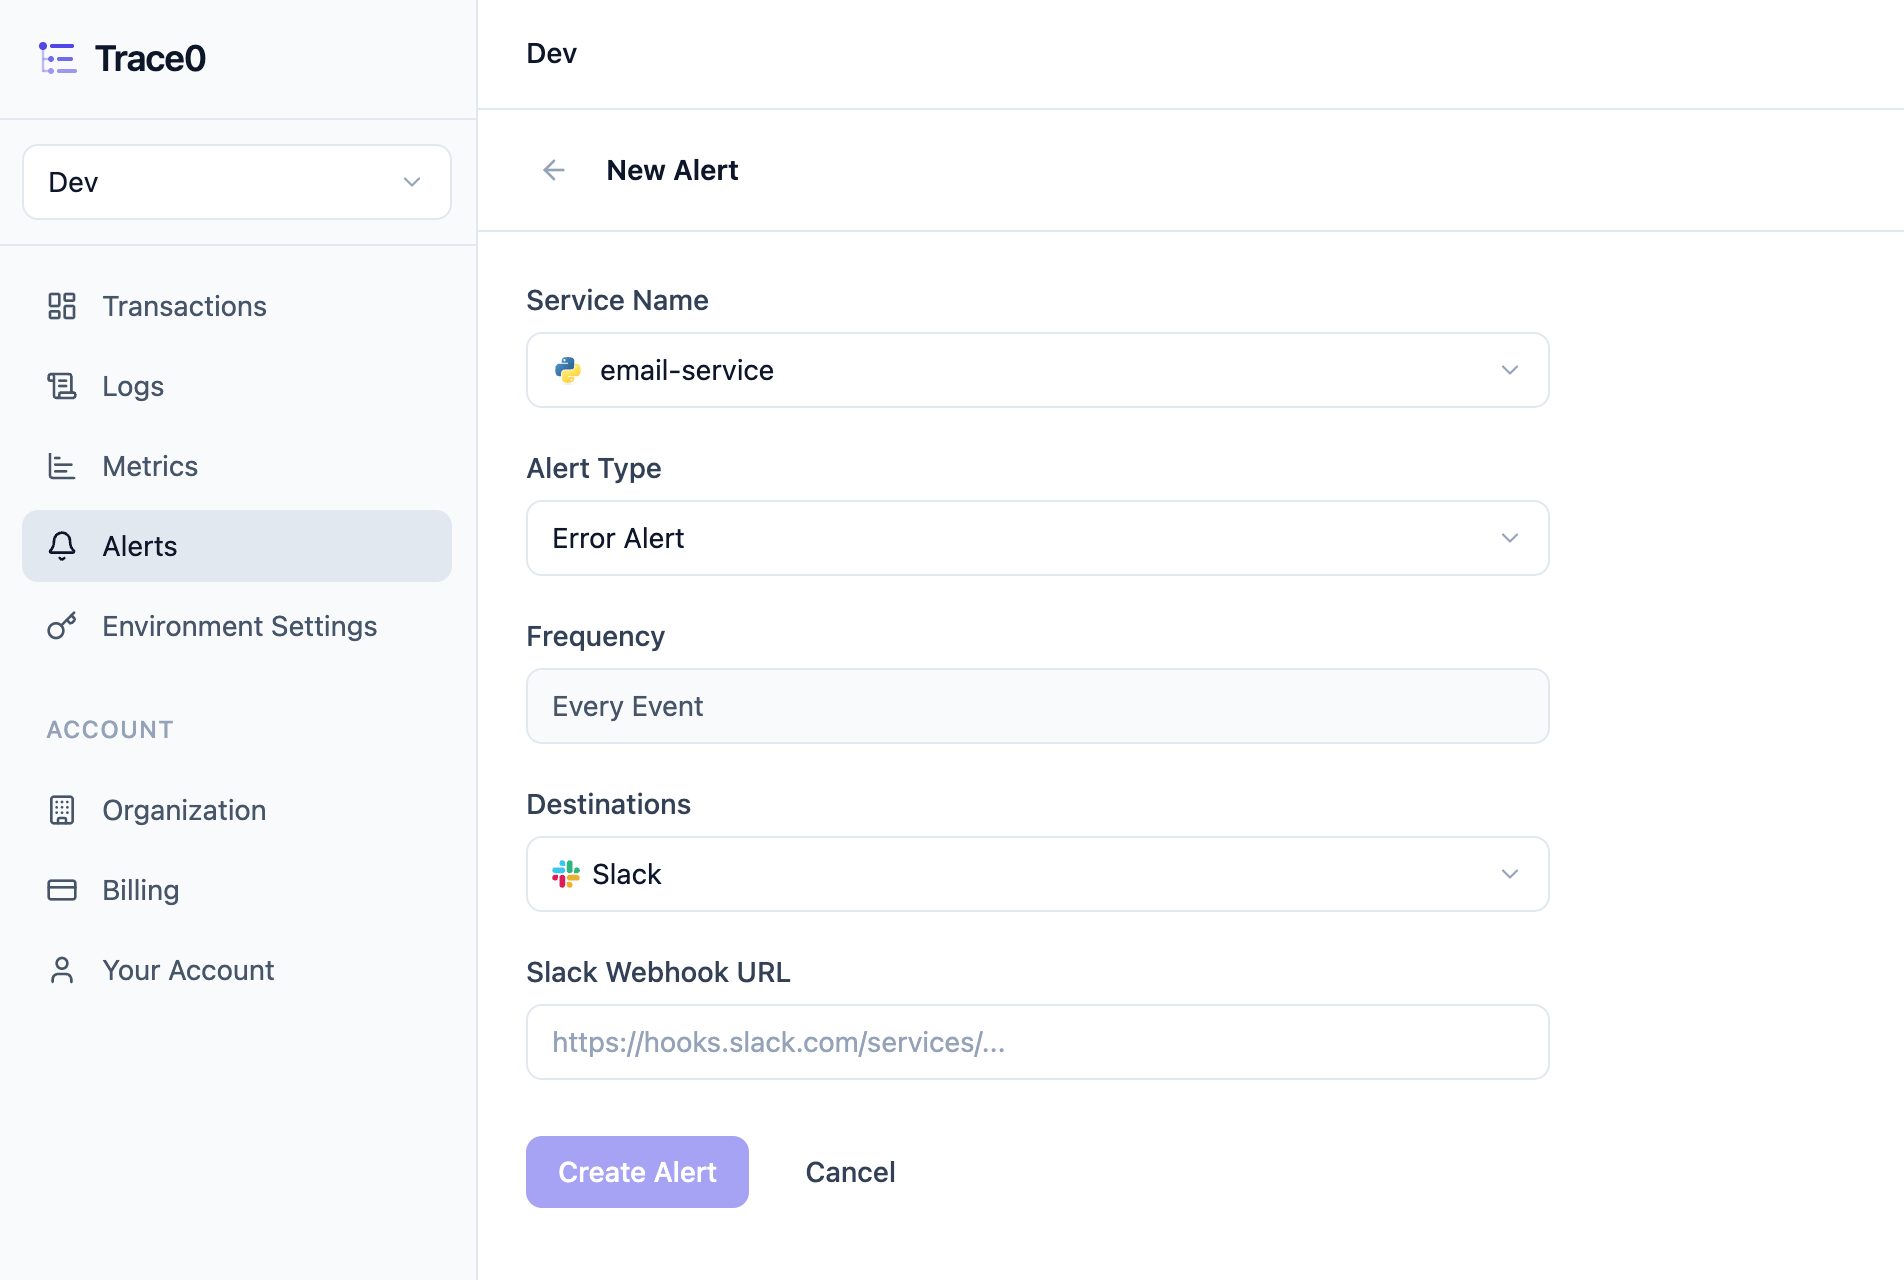
For error alerts, the frequency is automatically set to `Every Event`, meaning you will receive an alert each time a request to your service fails.
You can then set a `Destination` — Slack, Email, or both.
* If you select `Email`, enter the email address you want to receive alert notifications.
* If you select `Slack`, enter the [Webhook URL](https://docs.slack.dev/messaging/sending-messages-using-incoming-webhooks/) for the channel you want to receive alert notifications.
You can then select the service the alert applies to, then choose an alert type — [Error Alert](#error-alerts) or [Metric Alert](#metric-alerts).
### Error Alerts
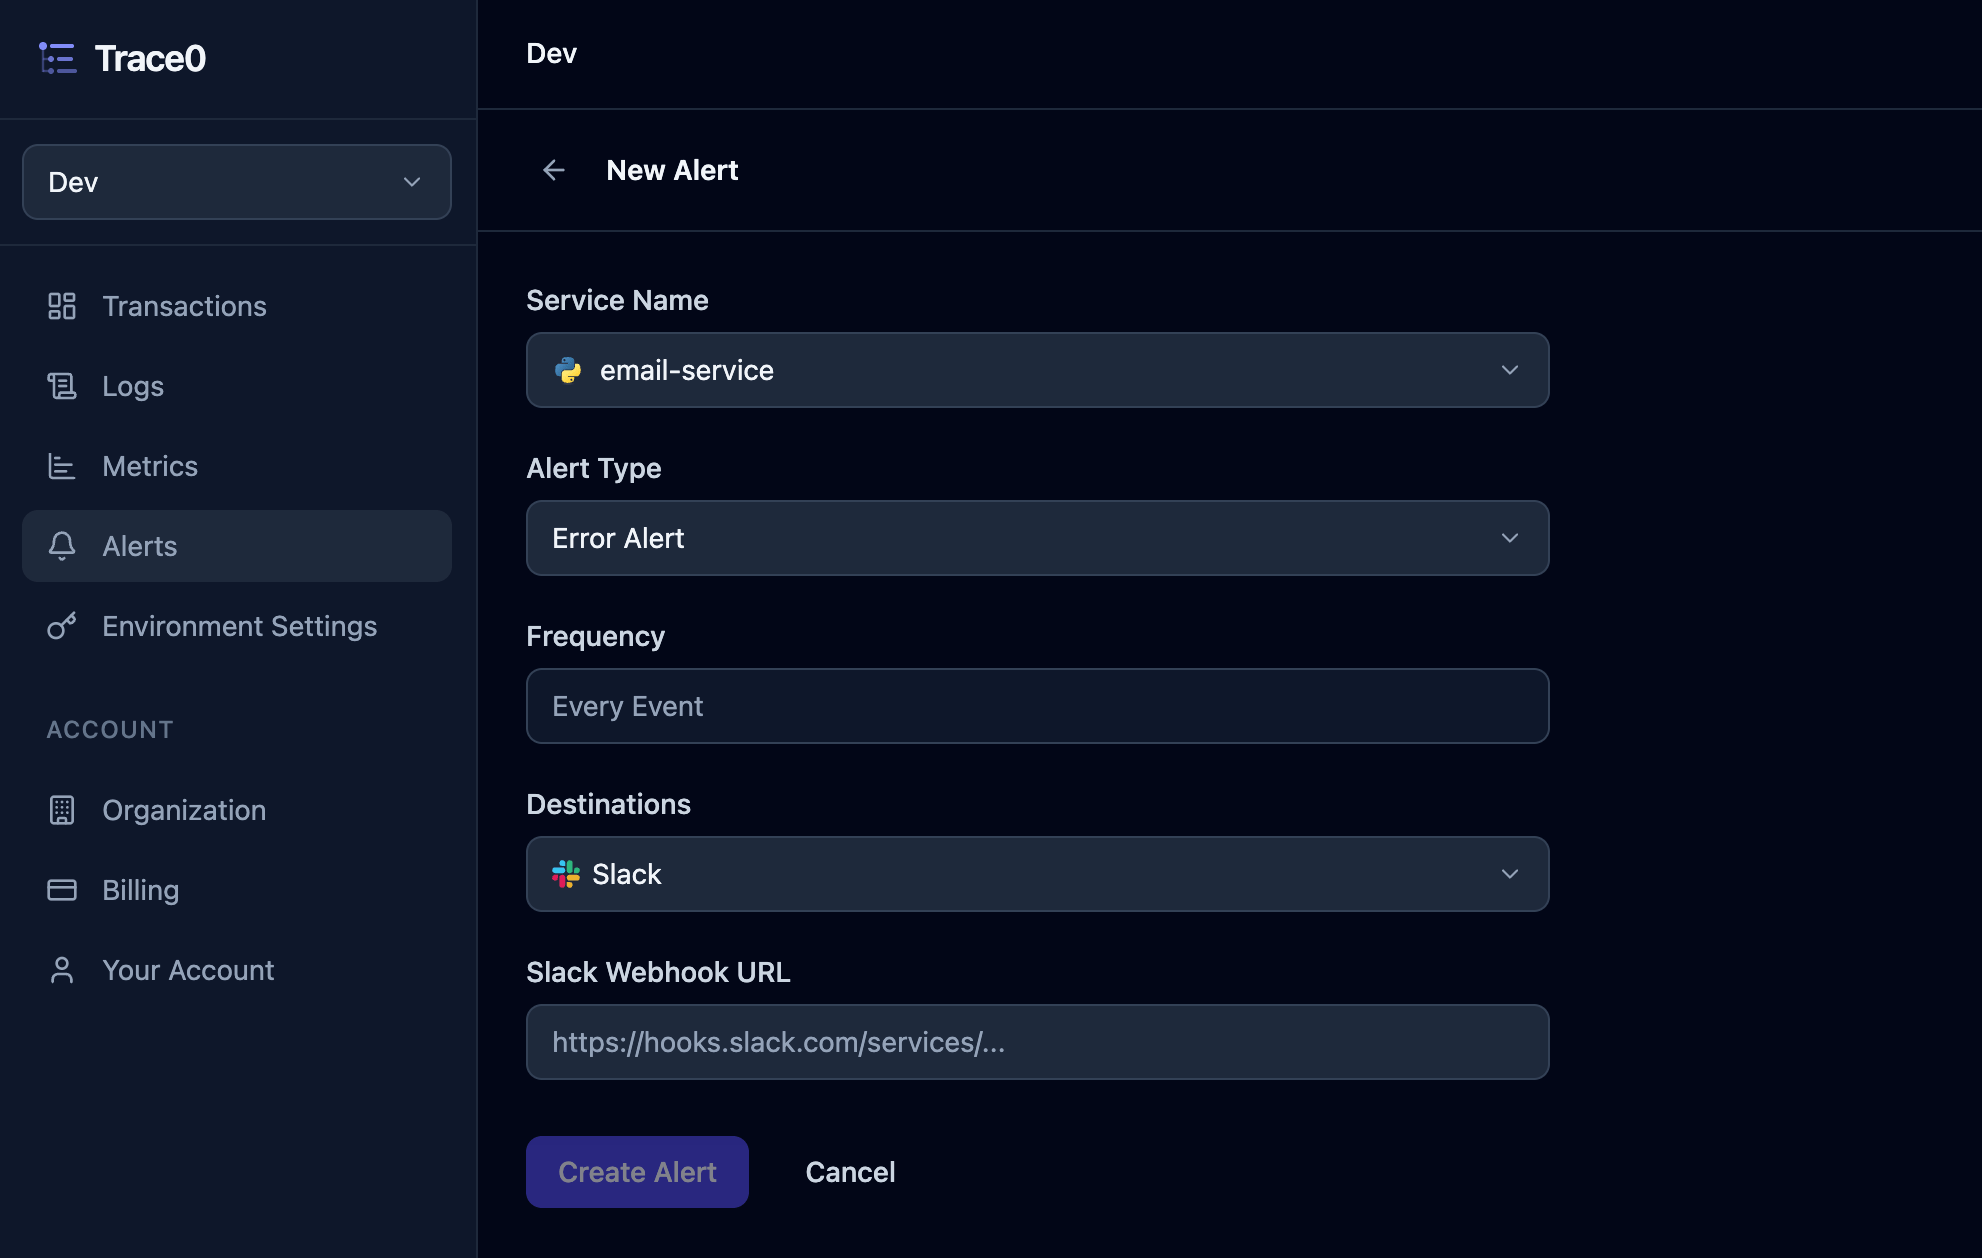
For error alerts, the frequency is automatically set to `Every Event`, meaning you will receive an alert each time a request to your service fails.
You can then set a `Destination` — Slack, Email, or both.
* If you select `Email`, enter the email address you want to receive alert notifications.
* If you select `Slack`, enter the [Webhook URL](https://docs.slack.dev/messaging/sending-messages-using-incoming-webhooks/) for the channel you want to receive alert notifications.
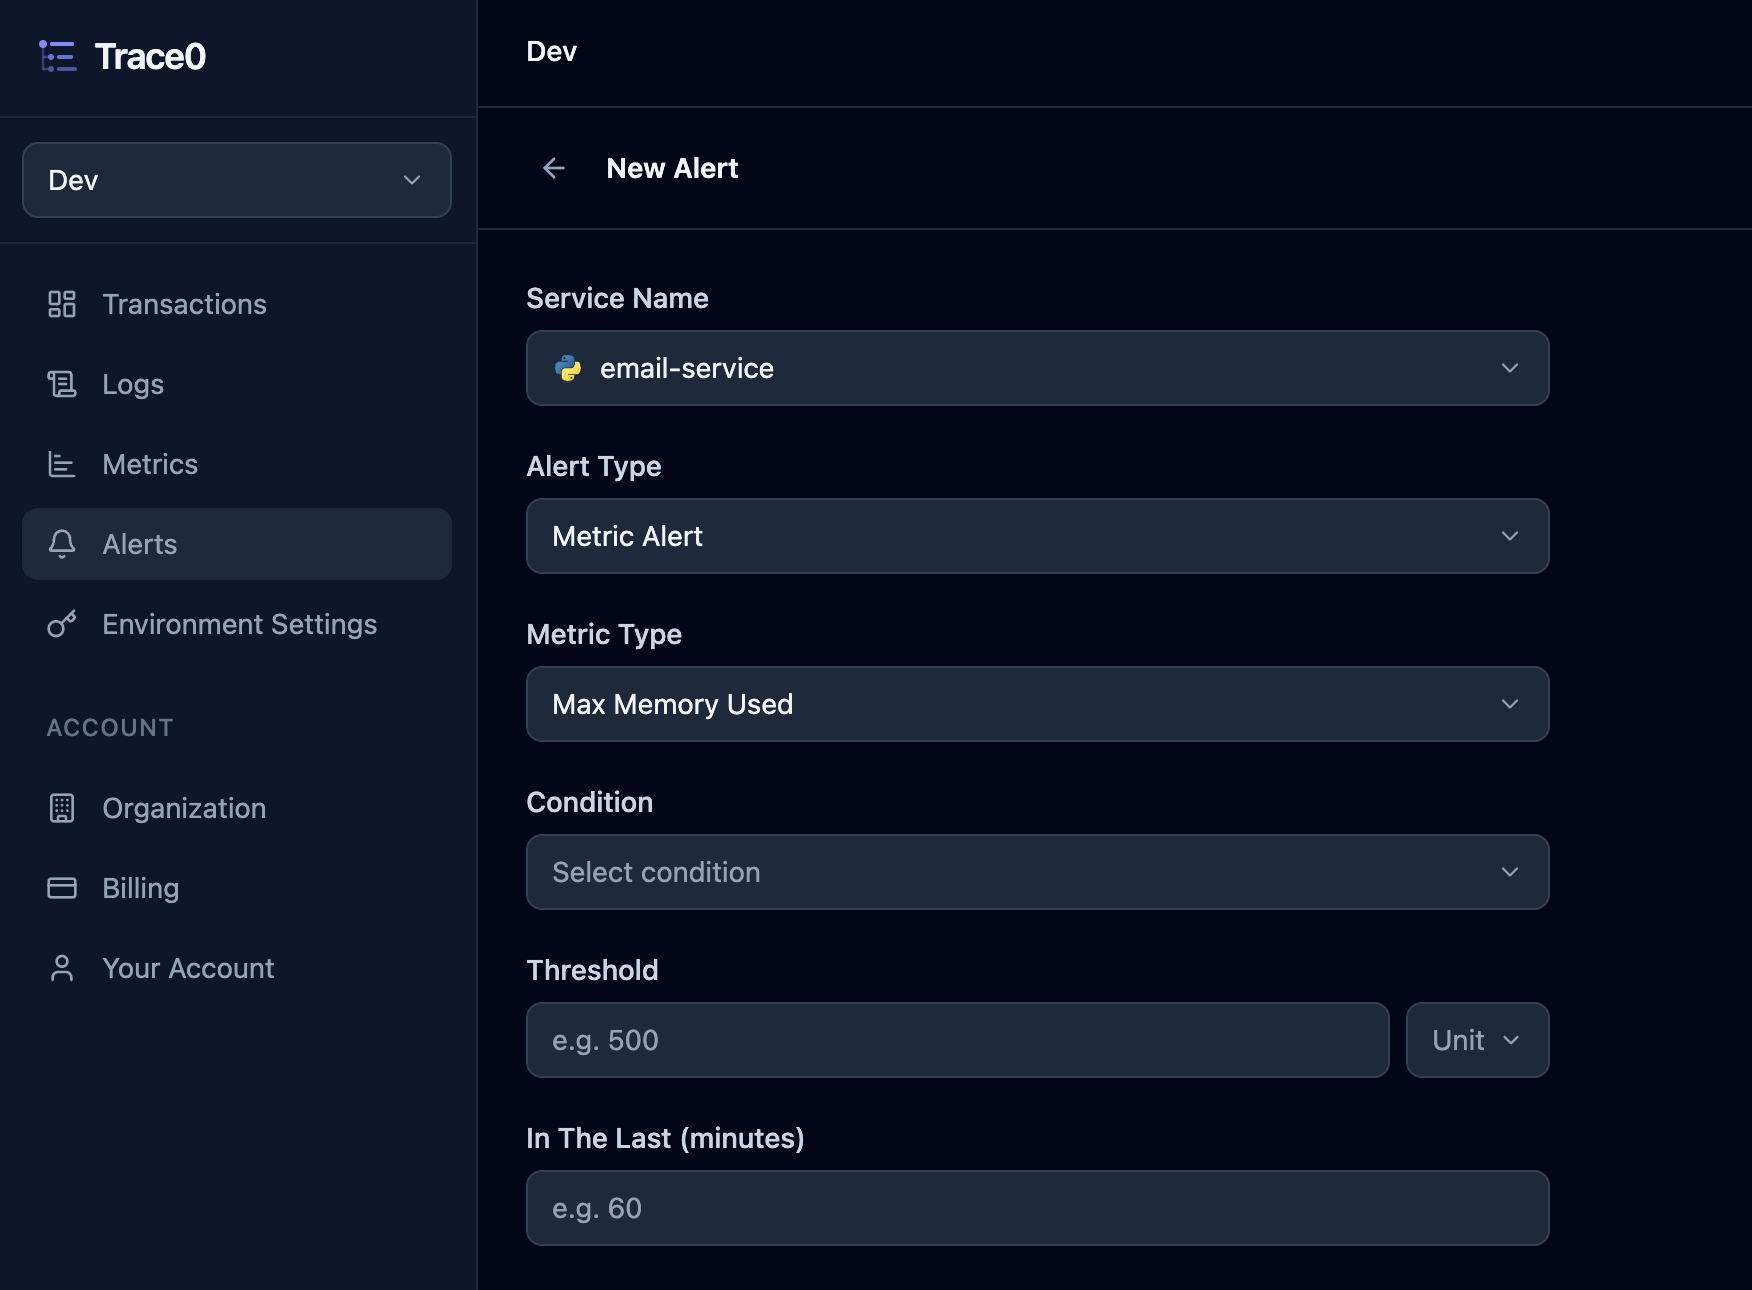
 ### Metric Alerts
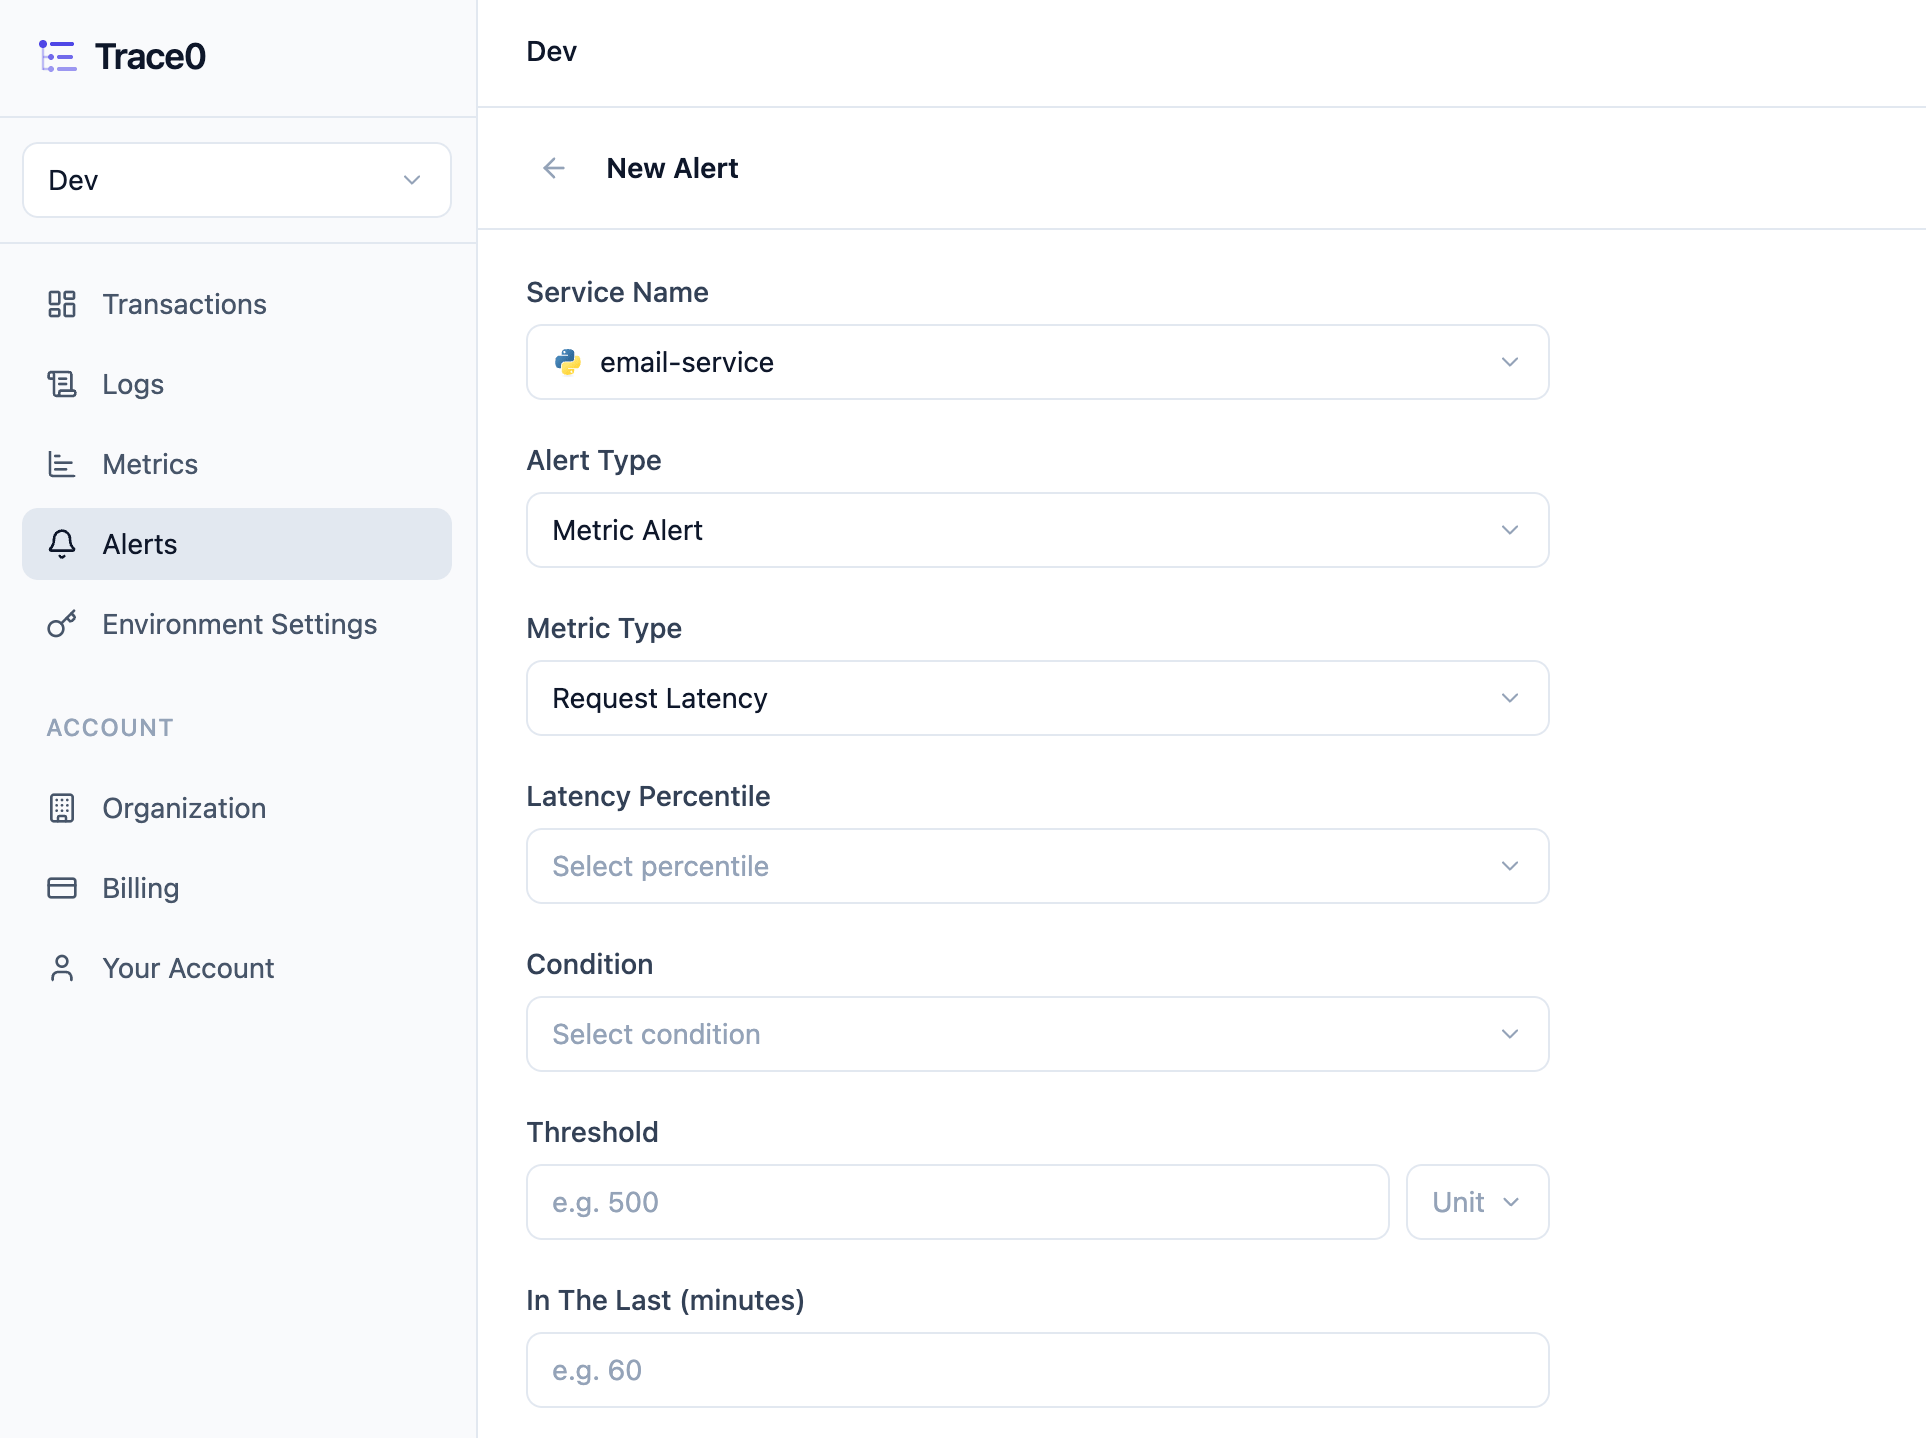
For metric alerts, you first select the `Metric Type` — Request Latency, Error Rate or Max Memory Used. Each type is explained in further detail below:
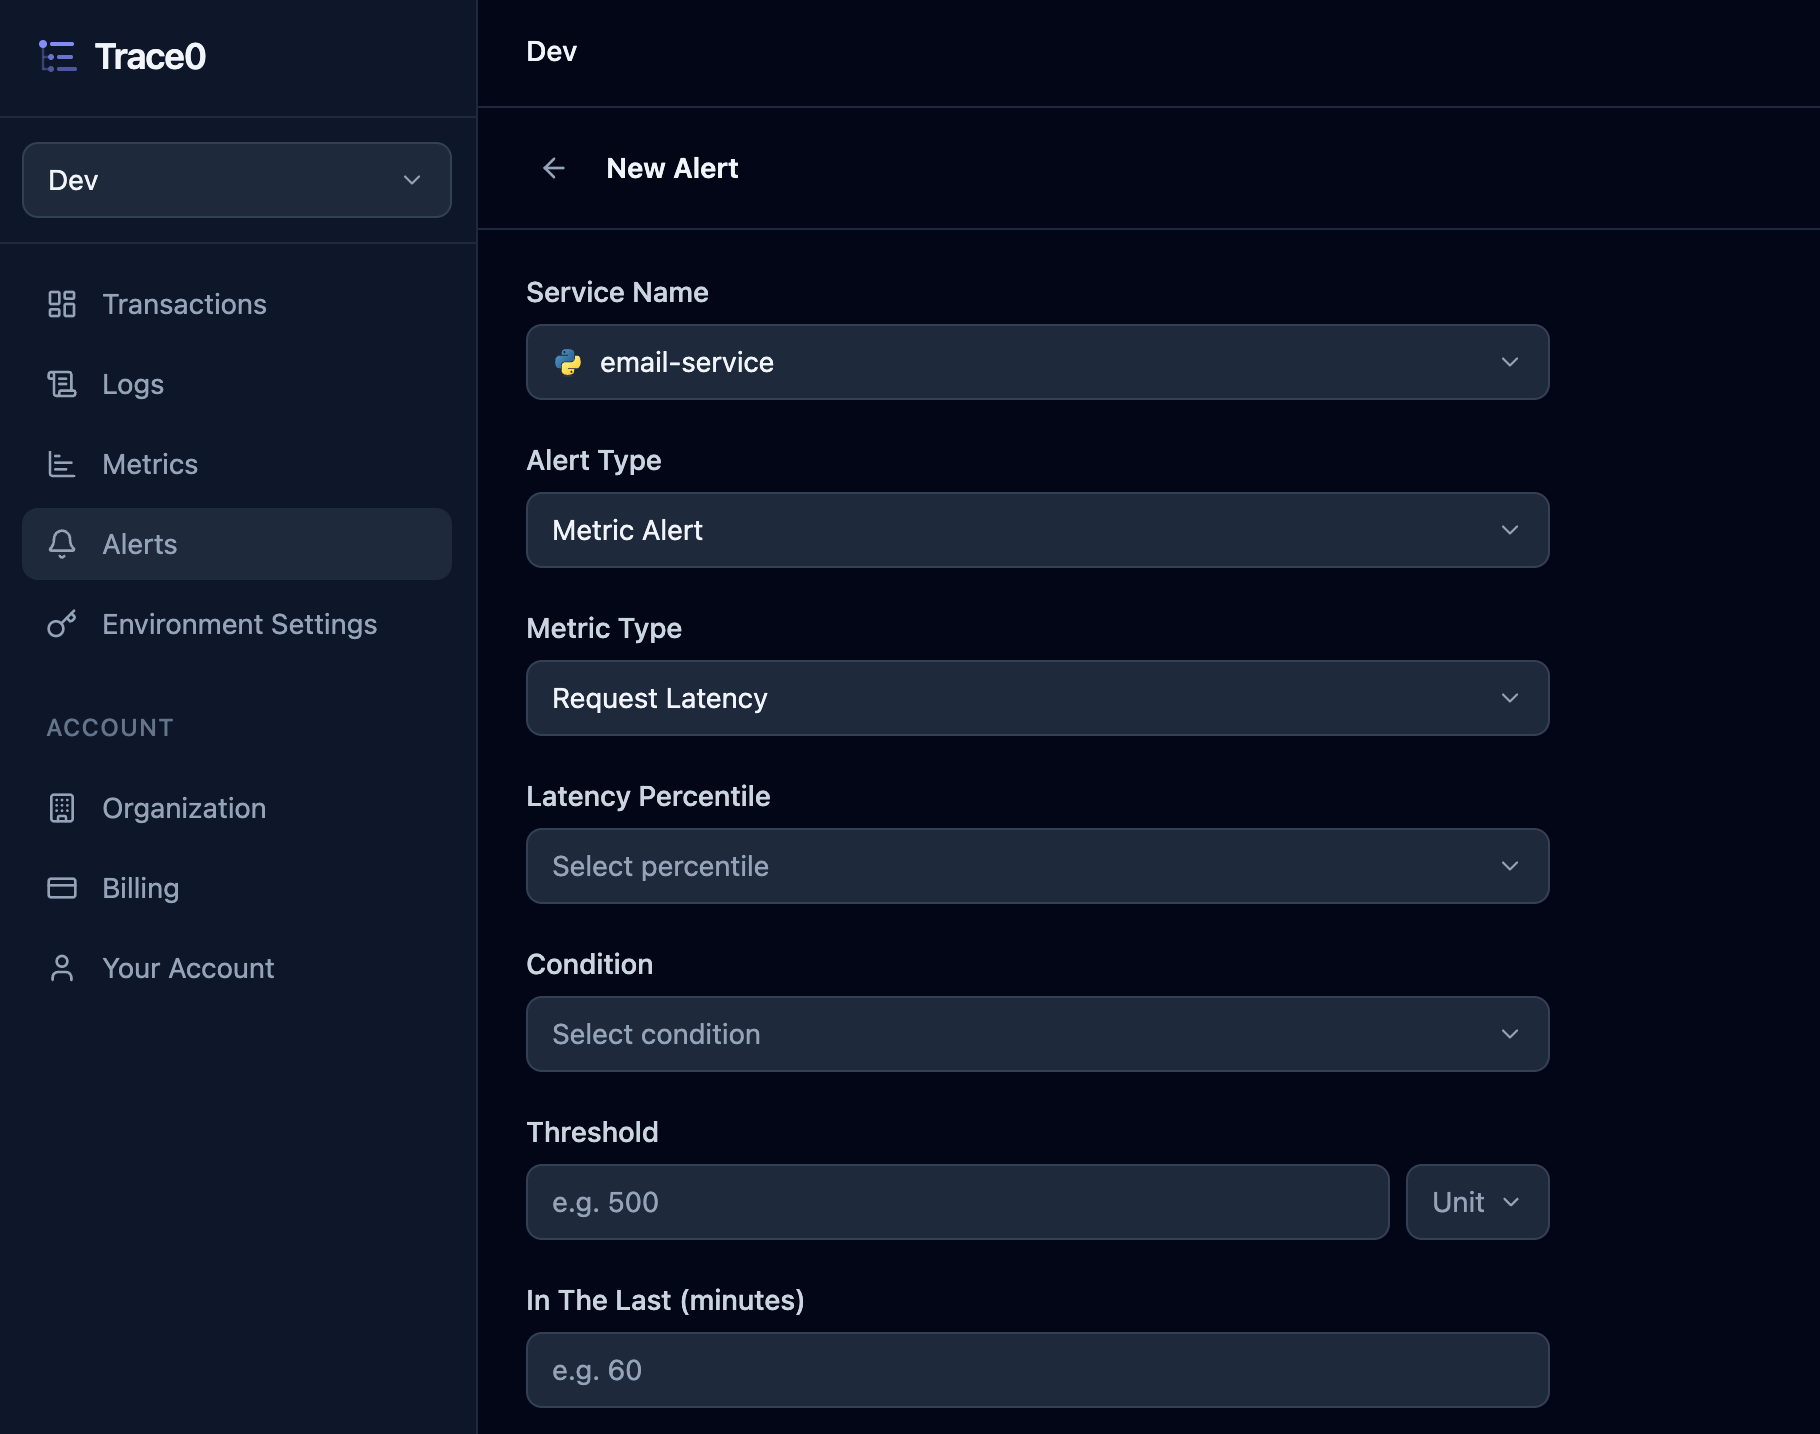
For Request Latency alerts, you can set the following parameters:
* `Latency Percentile` — P99, P95, P90, P75, P50
* `Condition` — Greater than, Greater than or equals, Less than, Less than or equals, Equals
* `Threshold` — A number in either milliseconds or seconds
* `In The Last (minutes)` — A number in minutes
### Metric Alerts
For metric alerts, you first select the `Metric Type` — Request Latency, Error Rate or Max Memory Used. Each type is explained in further detail below:
For Request Latency alerts, you can set the following parameters:
* `Latency Percentile` — P99, P95, P90, P75, P50
* `Condition` — Greater than, Greater than or equals, Less than, Less than or equals, Equals
* `Threshold` — A number in either milliseconds or seconds
* `In The Last (minutes)` — A number in minutes
 For Error Rate alerts, you can set the following parameters:
* `Condition` — Greater than, Greater than or equals, Less than, Less than or equals, Equals
* `Threshold` — A number as a percentage, i.e. the error rate
* `In The Last (minutes)` — A number in minutes
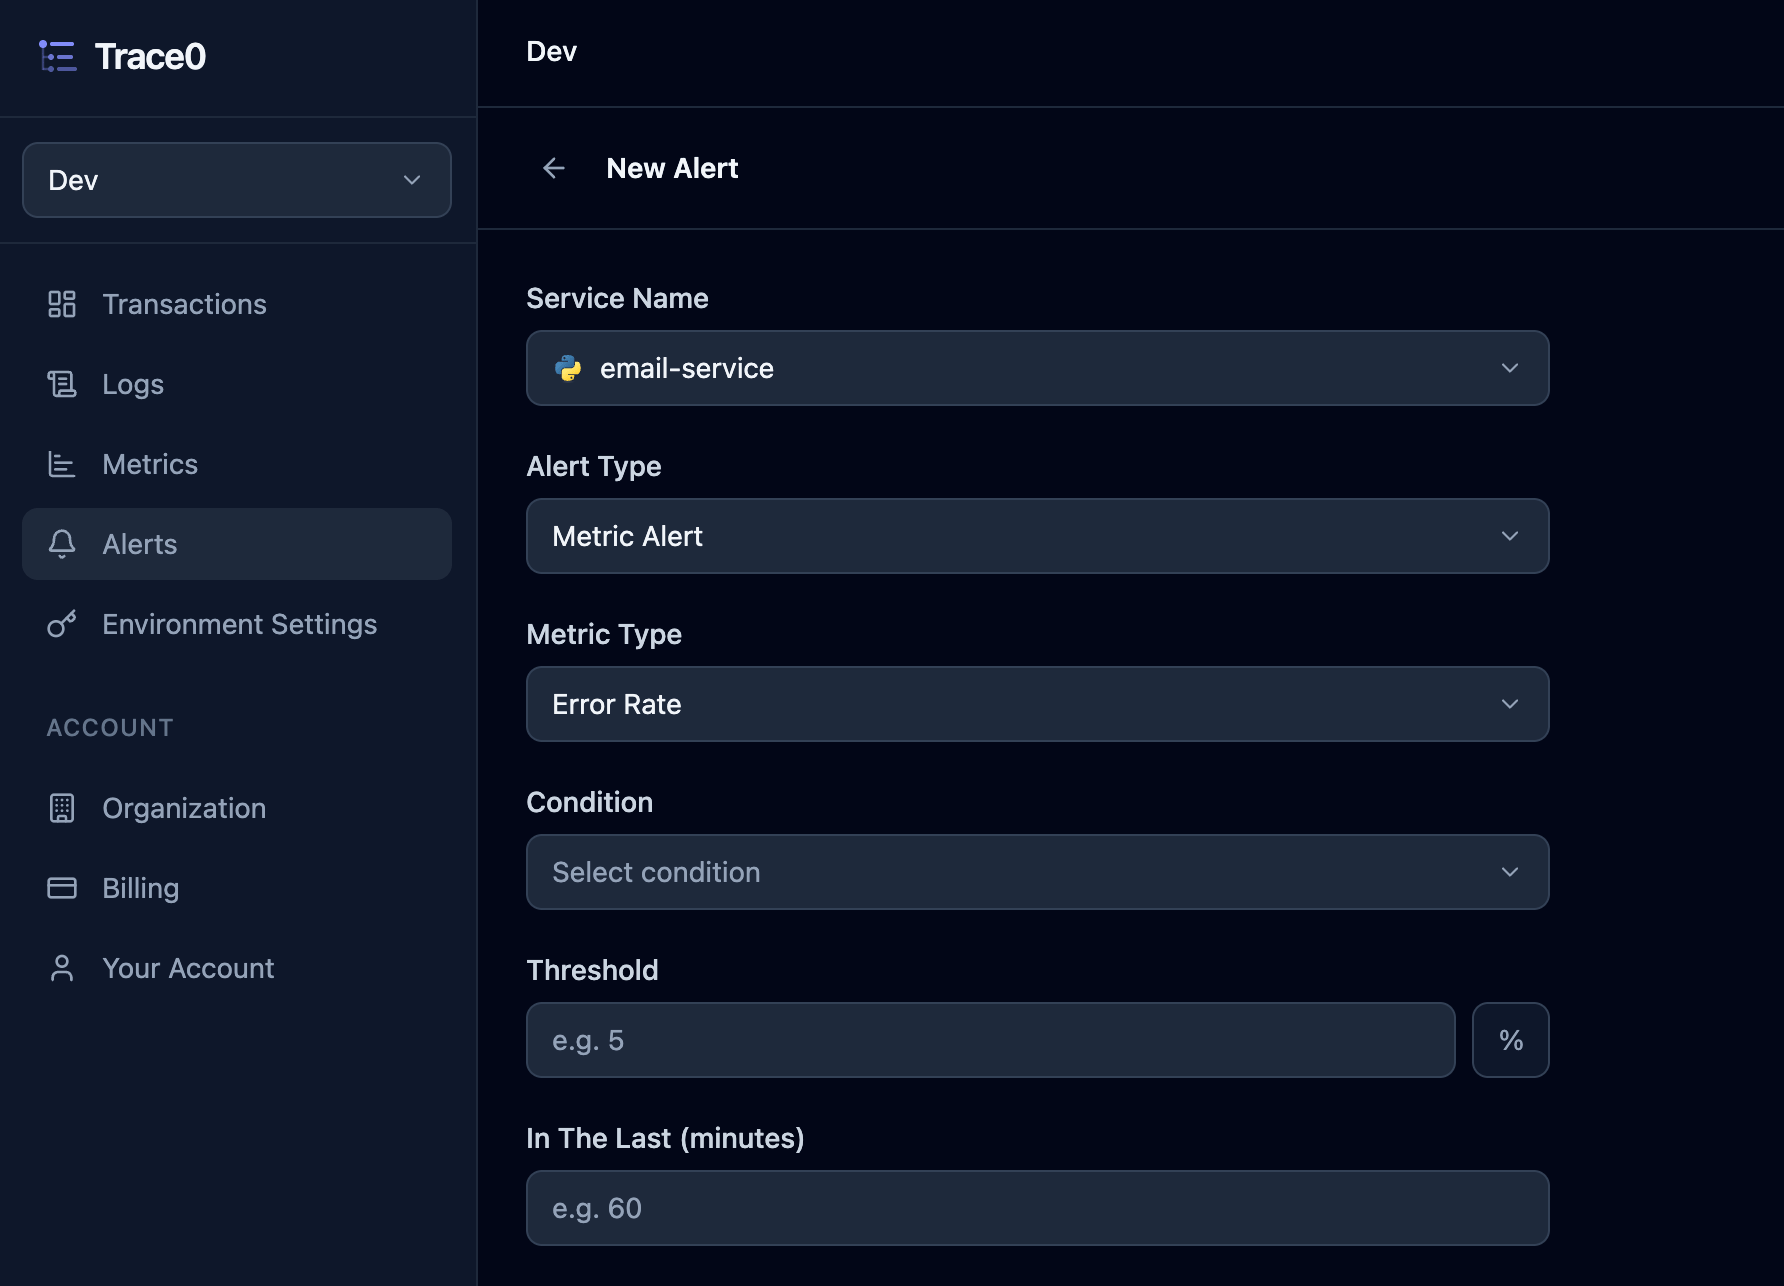
For Error Rate alerts, you can set the following parameters:
* `Condition` — Greater than, Greater than or equals, Less than, Less than or equals, Equals
* `Threshold` — A number as a percentage, i.e. the error rate
* `In The Last (minutes)` — A number in minutes

 For Max Memory Used alerts, you can set the following parameters:
* `Condition` — Greater than, Greater than or equals, Less than, Less than or equals, Equals
* `Threshold` — A number in KB, MB, or GB
* `In The Last (minutes)` — A number in minutes
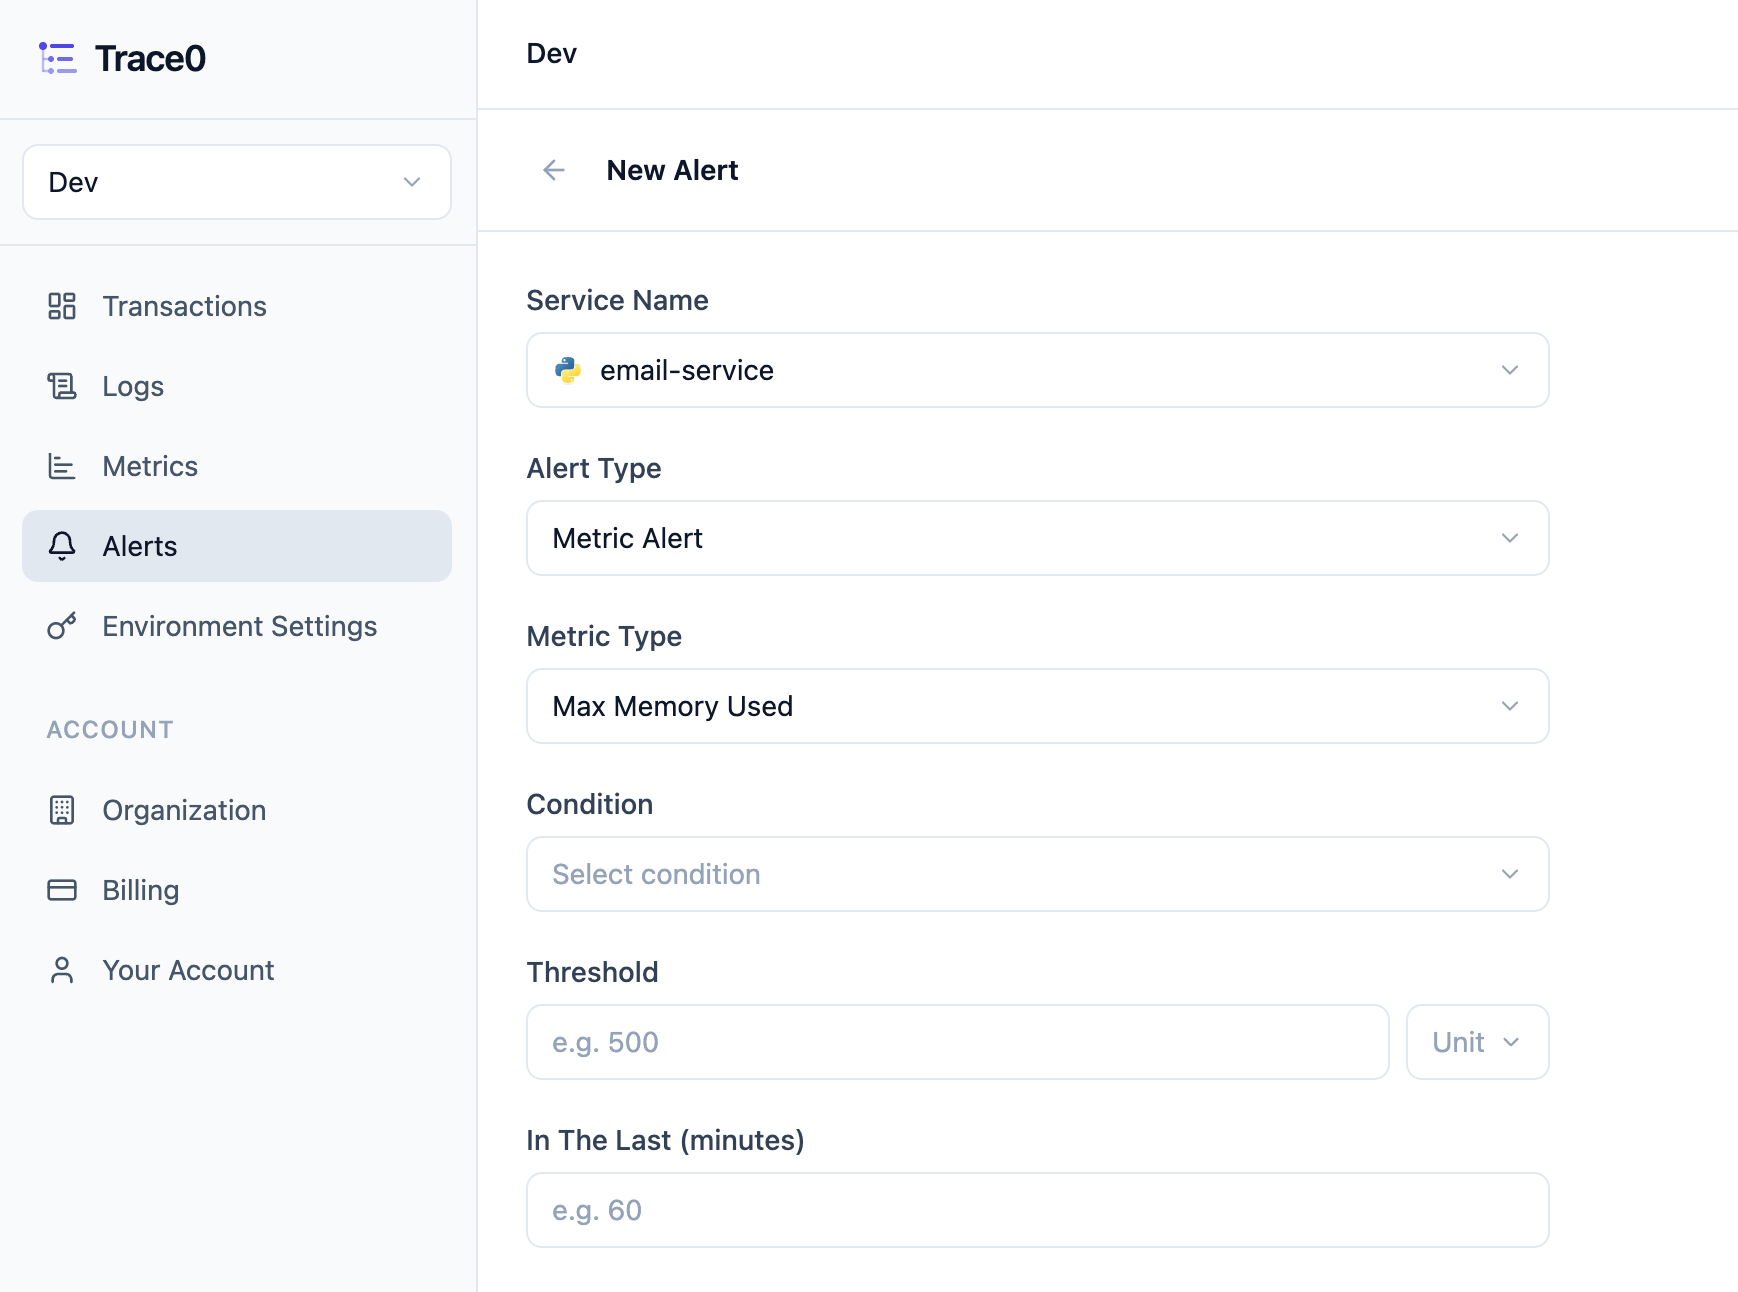
For Max Memory Used alerts, you can set the following parameters:
* `Condition` — Greater than, Greater than or equals, Less than, Less than or equals, Equals
* `Threshold` — A number in KB, MB, or GB
* `In The Last (minutes)` — A number in minutes
 Finally, you can set a `Destination` — Slack, Email, or both.
* If you select `Email`, enter the email address you want to receive alert notifications.
* If you select `Slack`, enter the [Webhook URL](https://docs.slack.dev/messaging/sending-messages-using-incoming-webhooks/) for the channel you want to receive alert notifications.
## Triggered Alerts
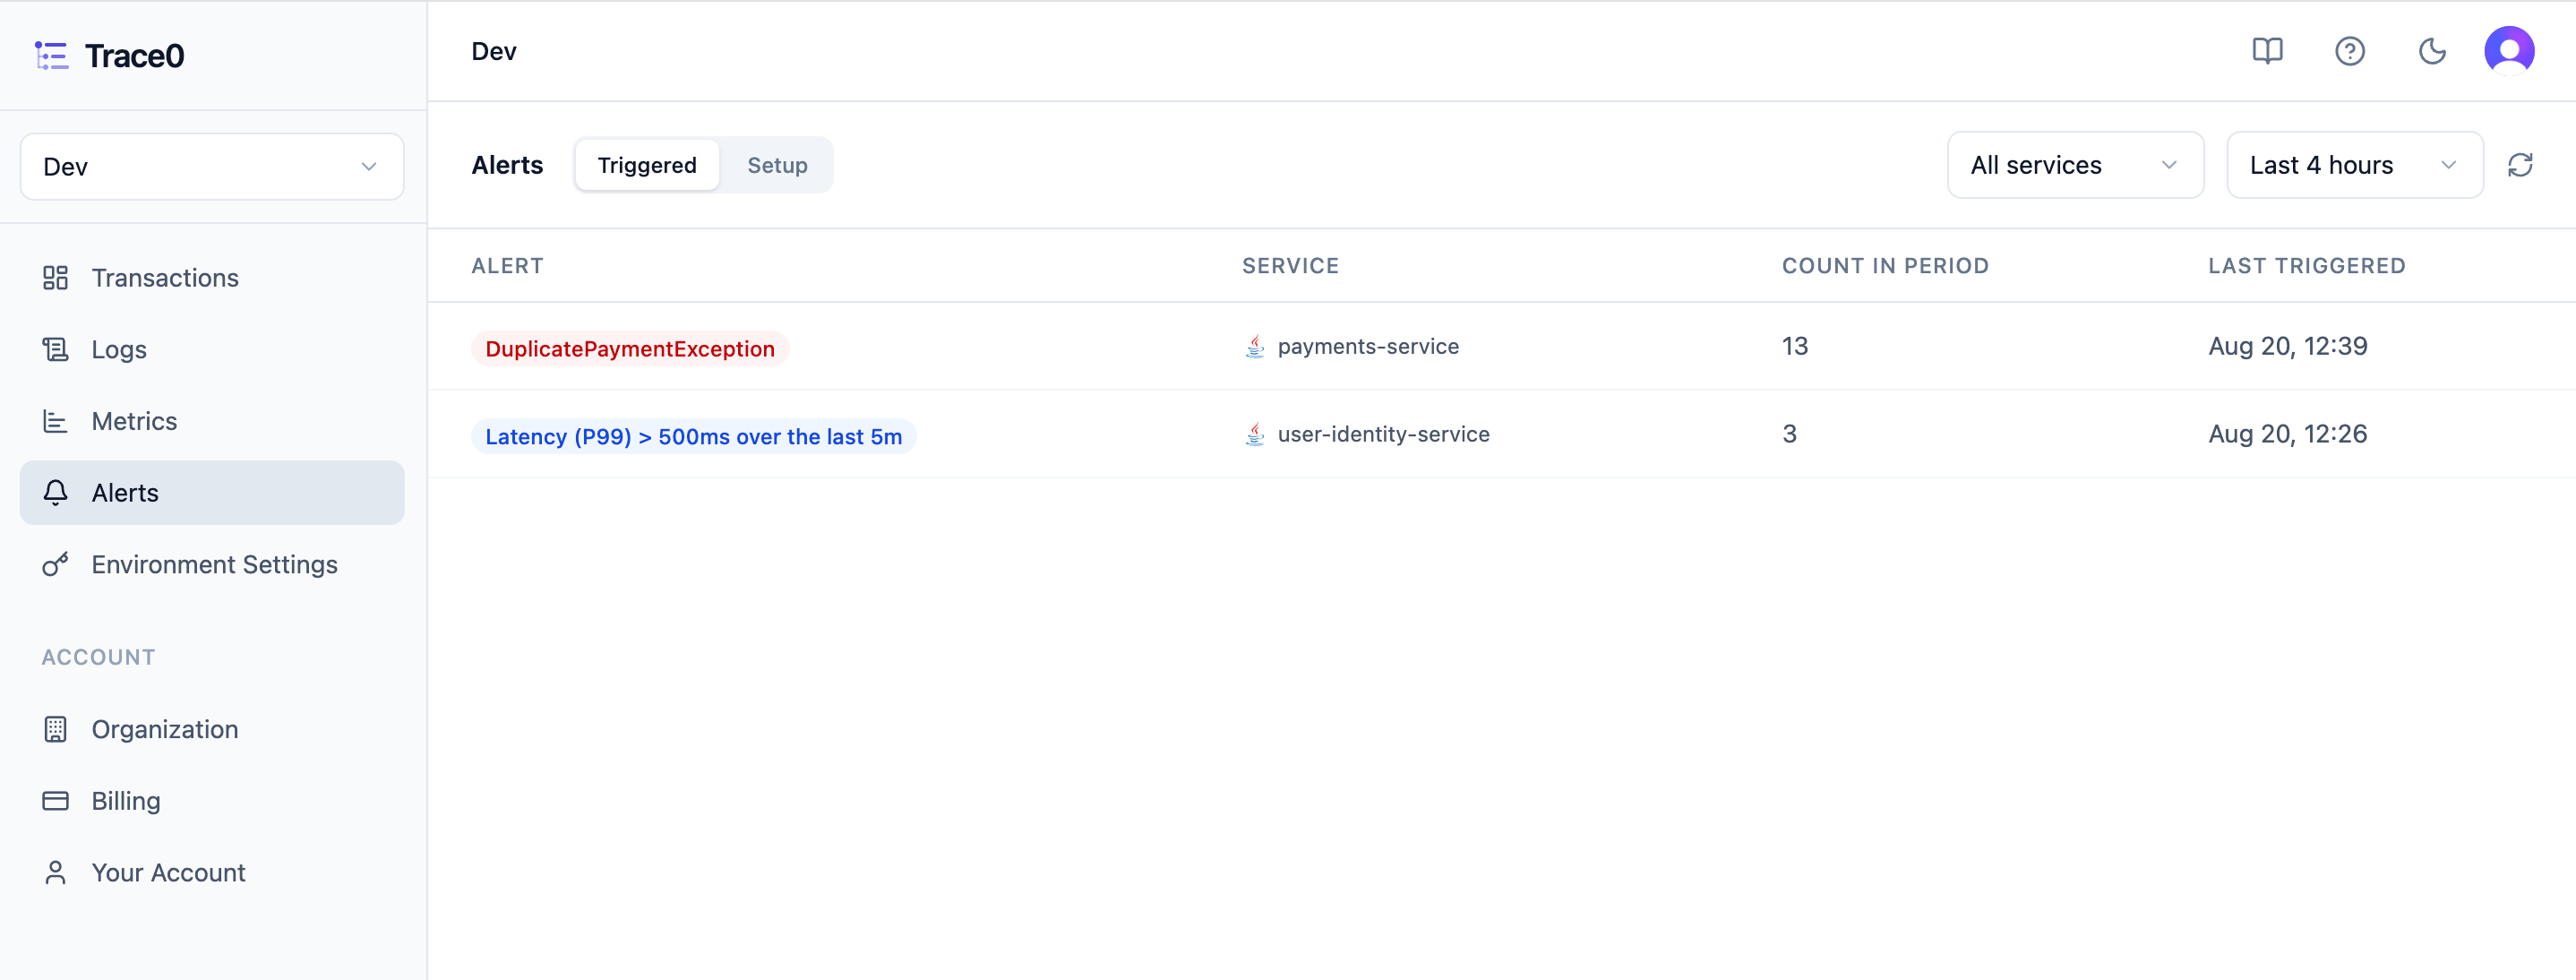
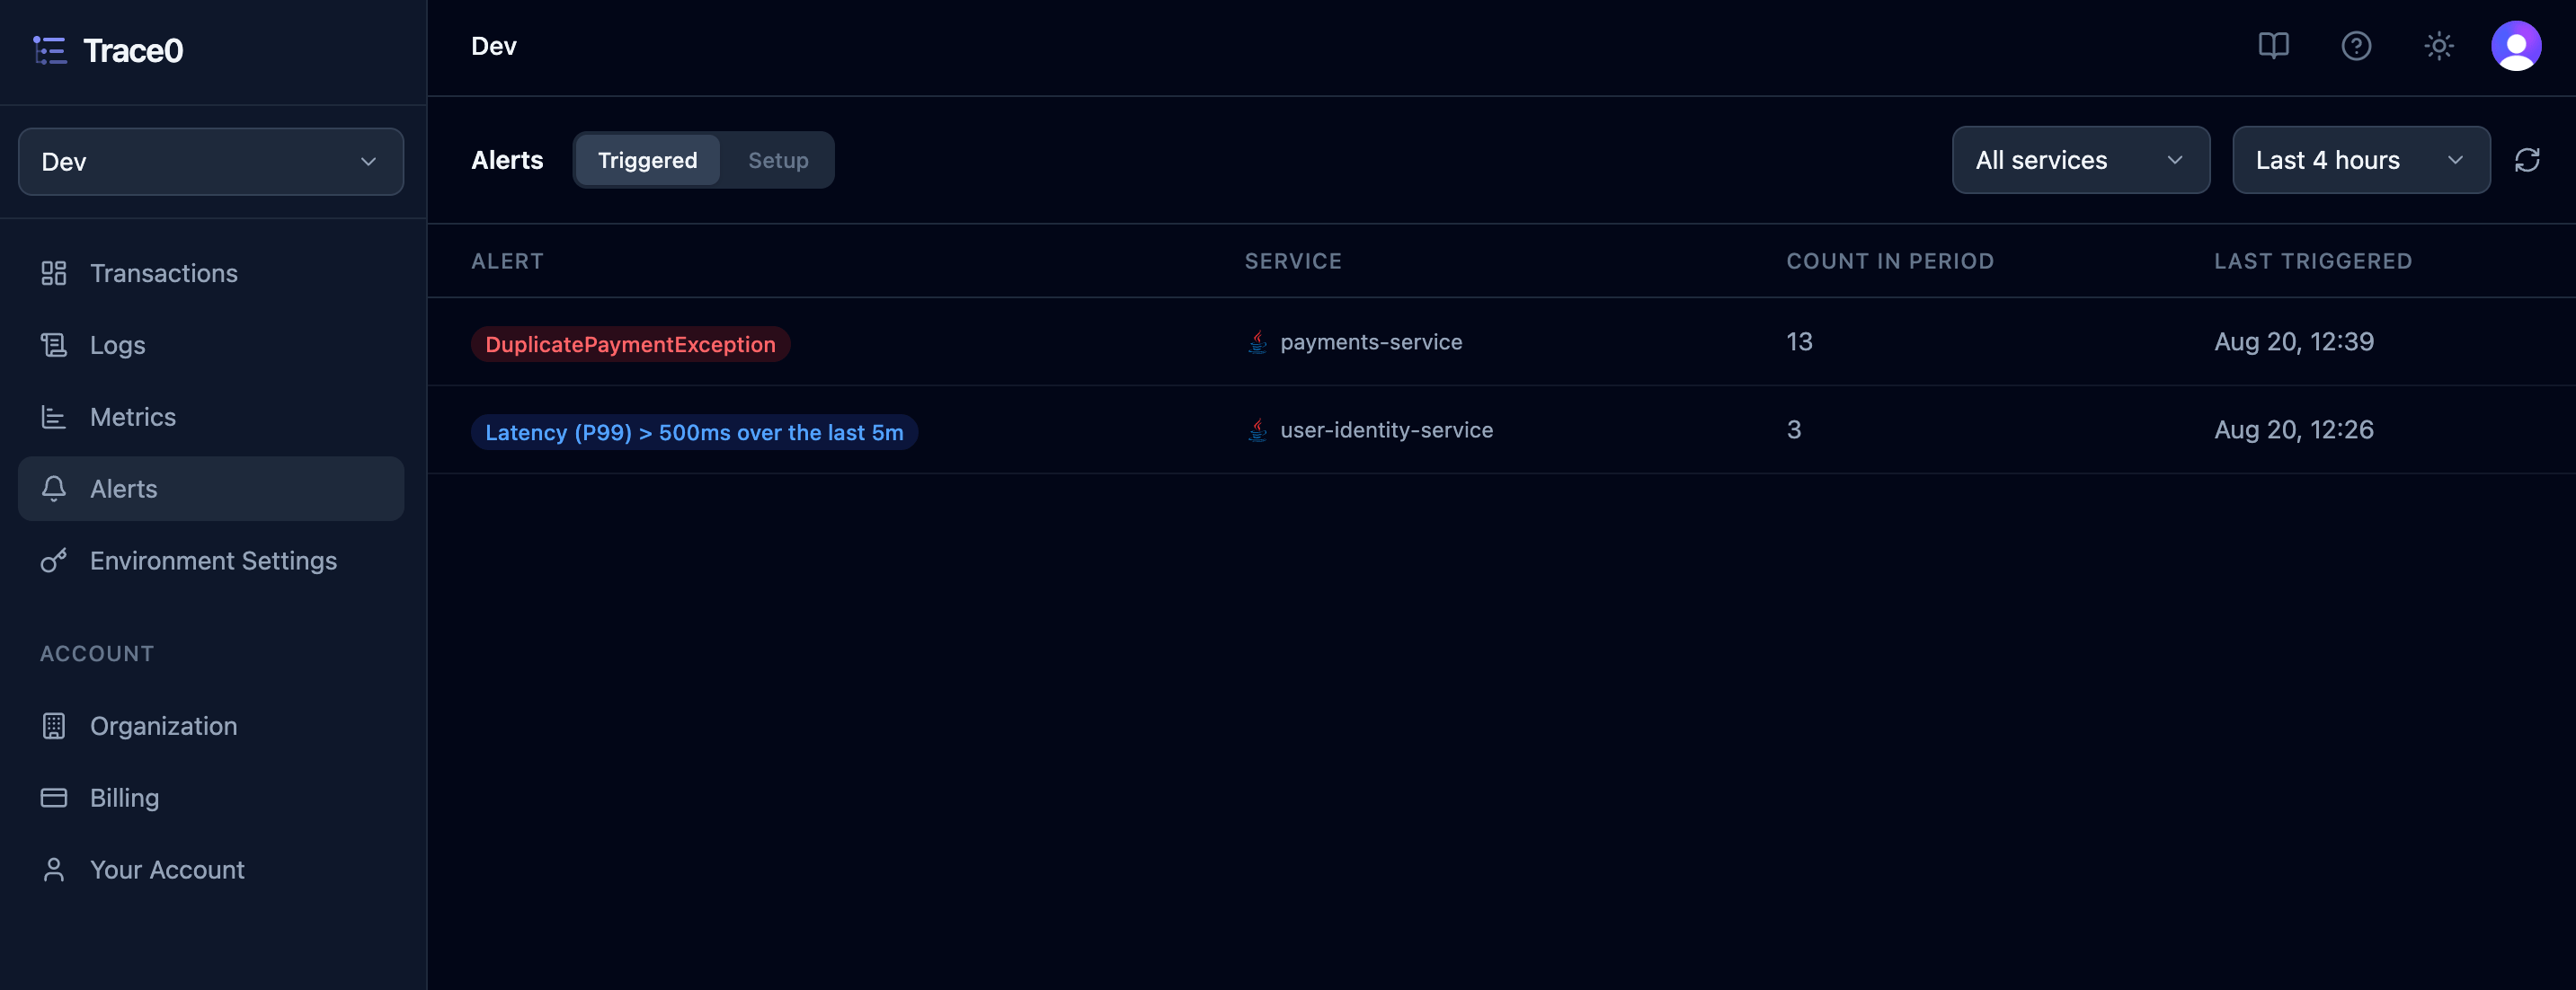
Once an alert is triggered, you will be notified in the Destinations that you configured for the alert, and it will also appear in the `Triggered` section:
Finally, you can set a `Destination` — Slack, Email, or both.
* If you select `Email`, enter the email address you want to receive alert notifications.
* If you select `Slack`, enter the [Webhook URL](https://docs.slack.dev/messaging/sending-messages-using-incoming-webhooks/) for the channel you want to receive alert notifications.
## Triggered Alerts
Once an alert is triggered, you will be notified in the Destinations that you configured for the alert, and it will also appear in the `Triggered` section:
 You can then click into a triggered alert to view more details about the alert.
### Error Alert Detail
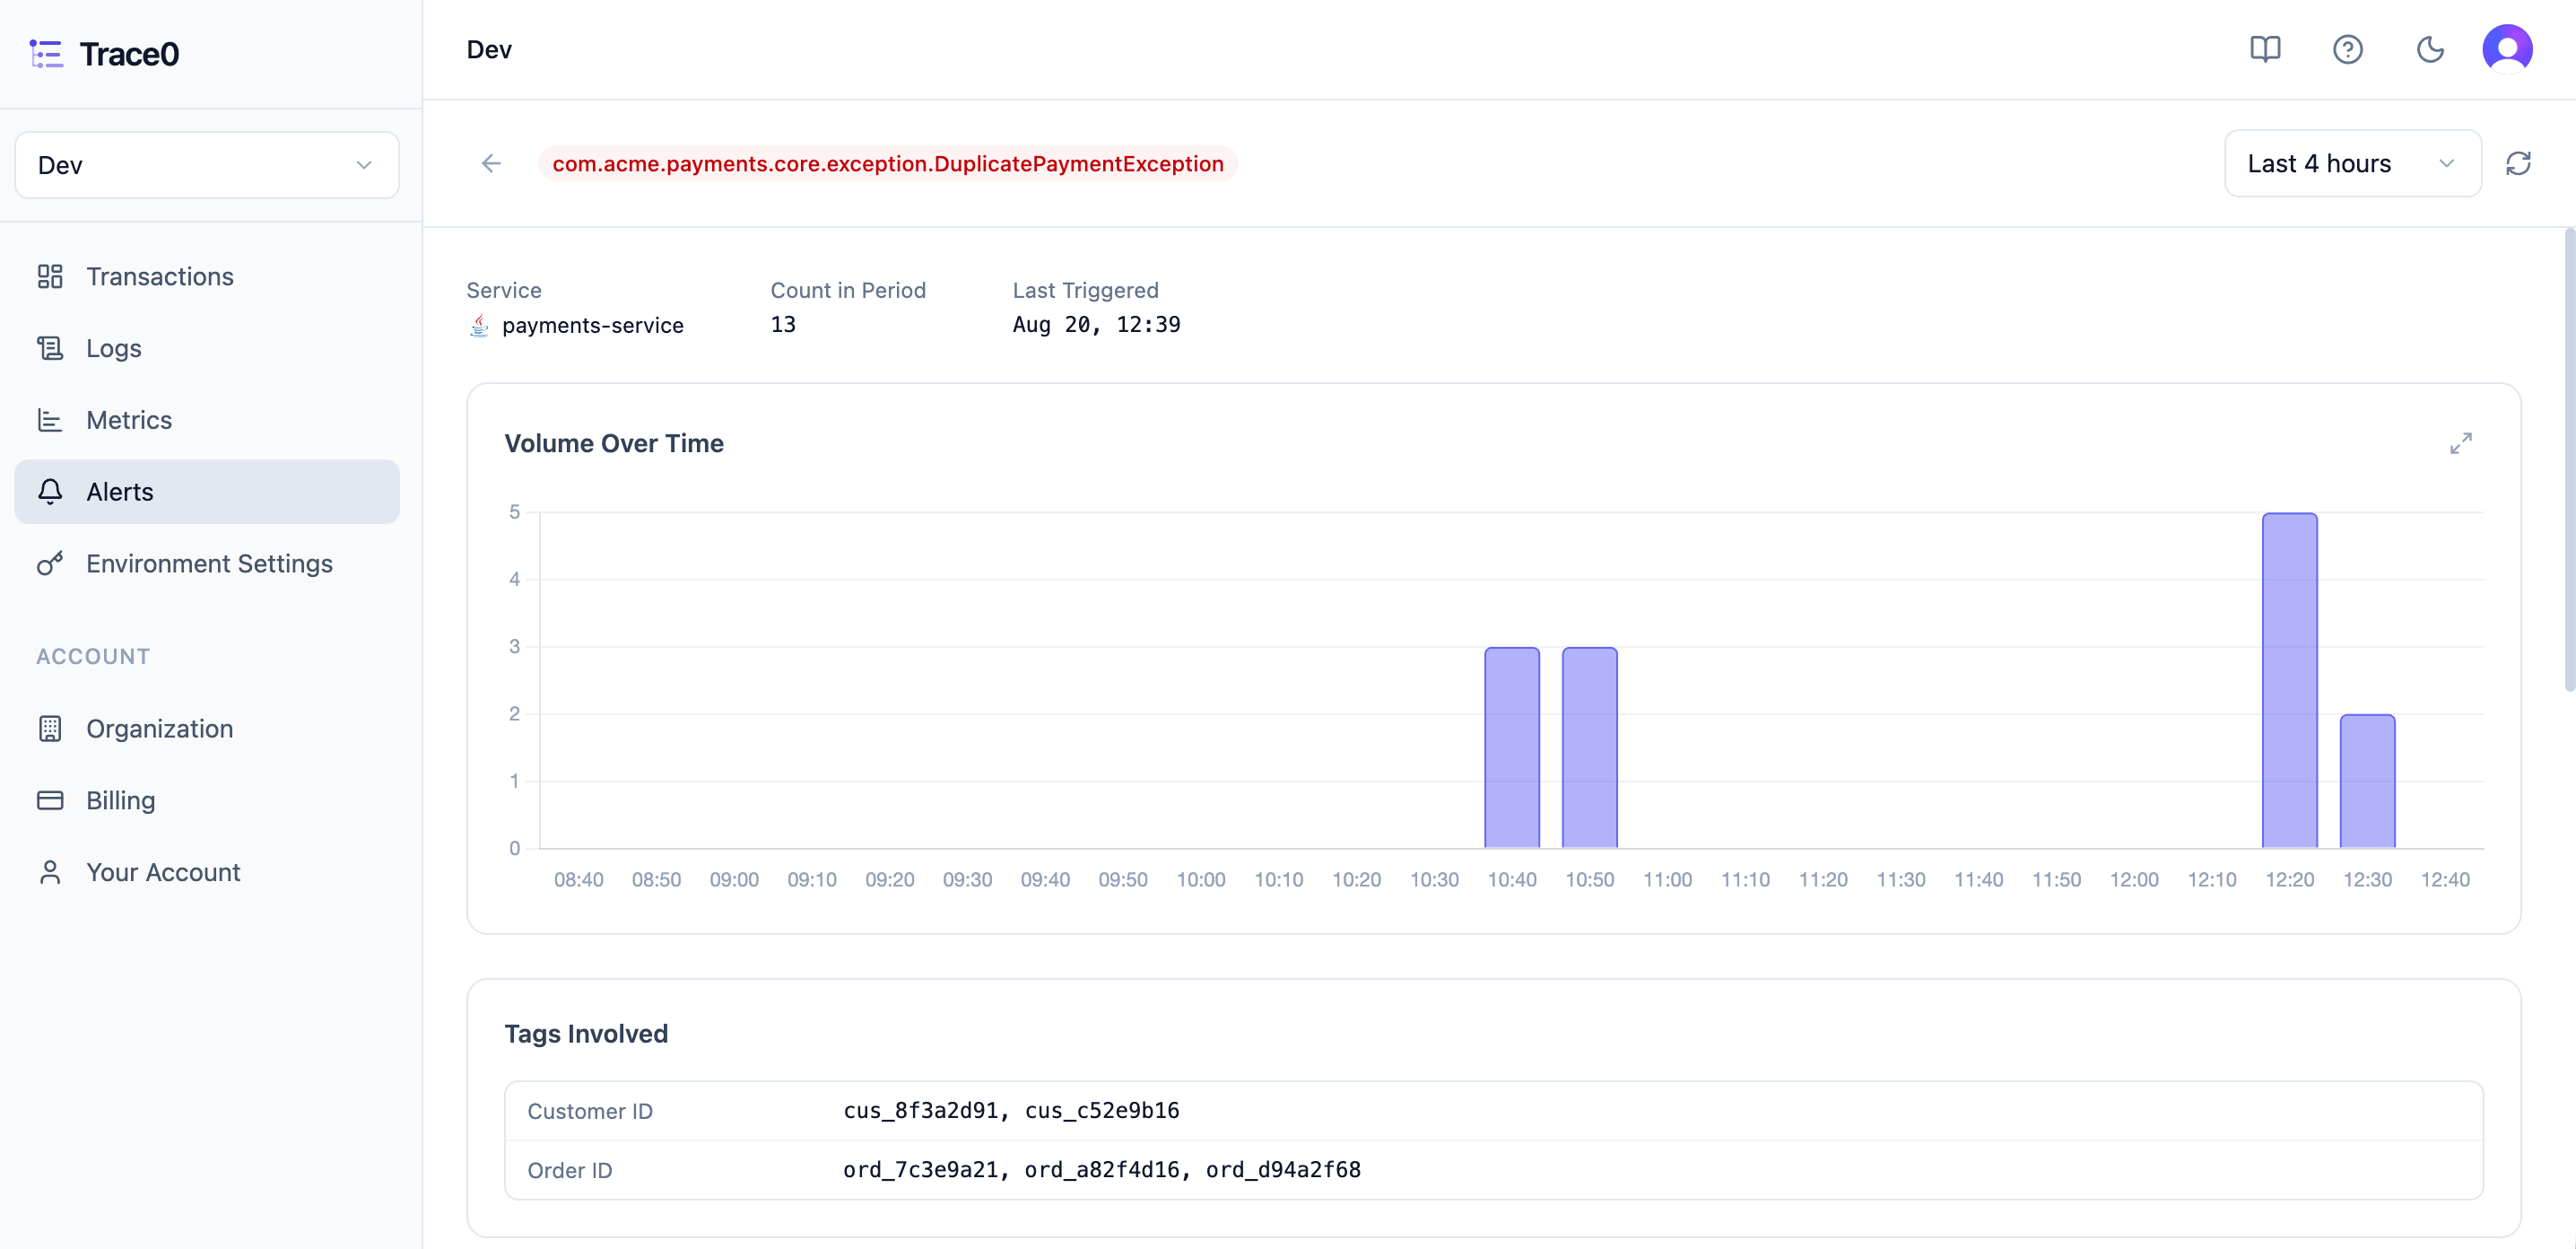
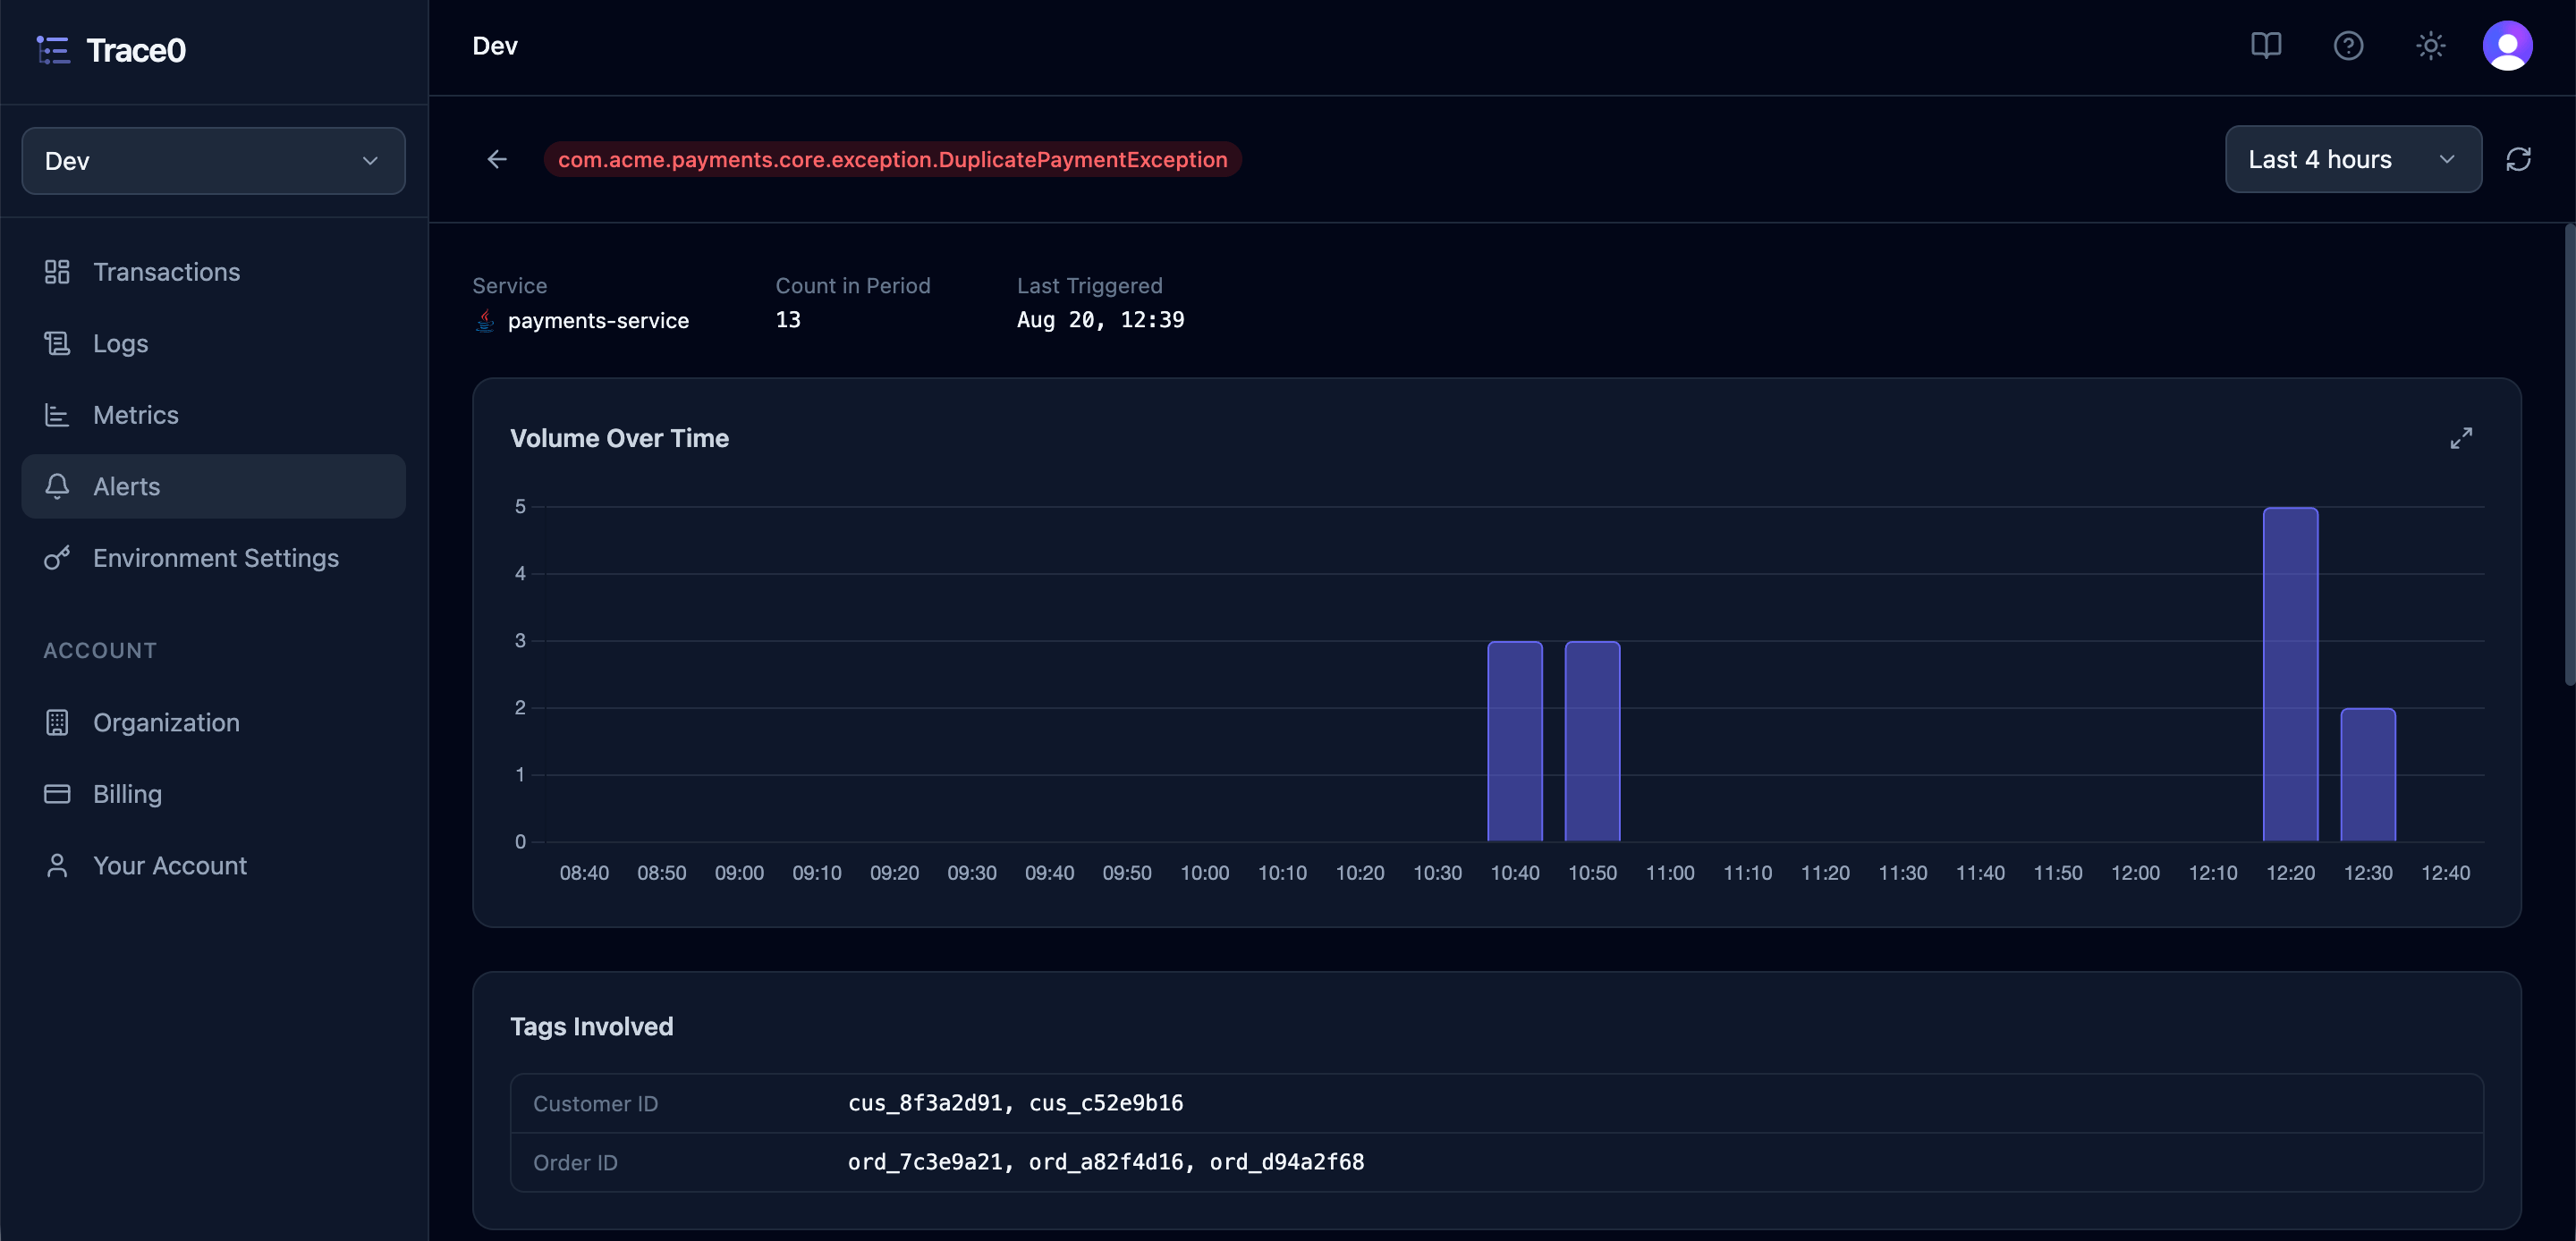
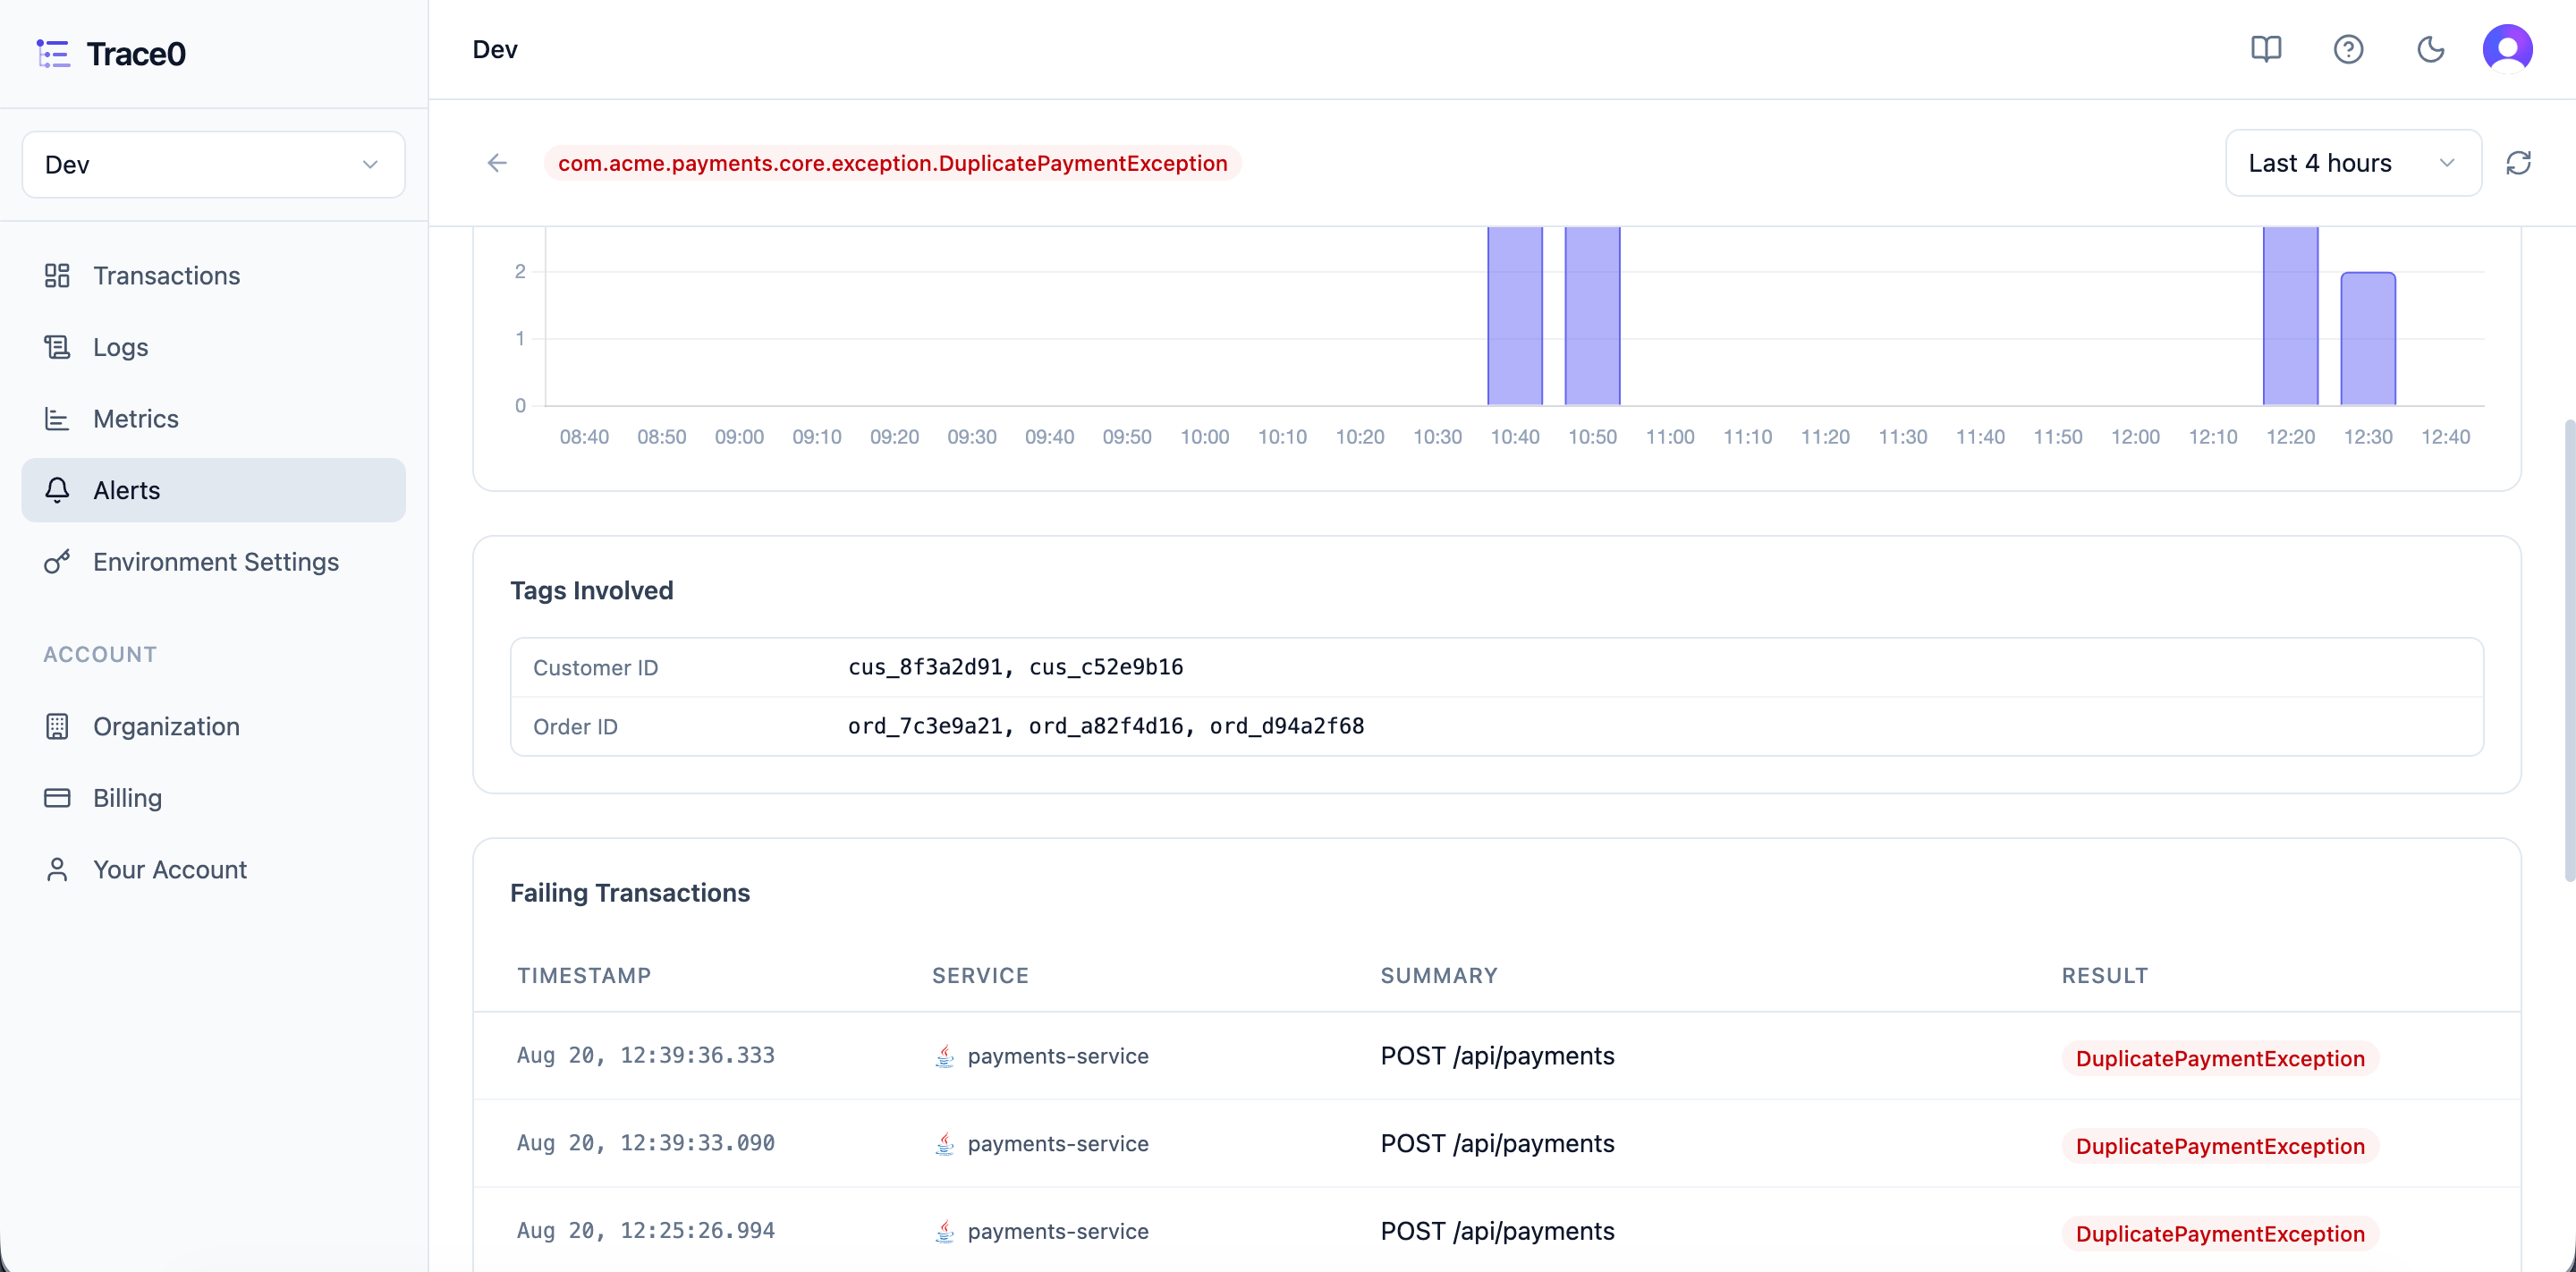
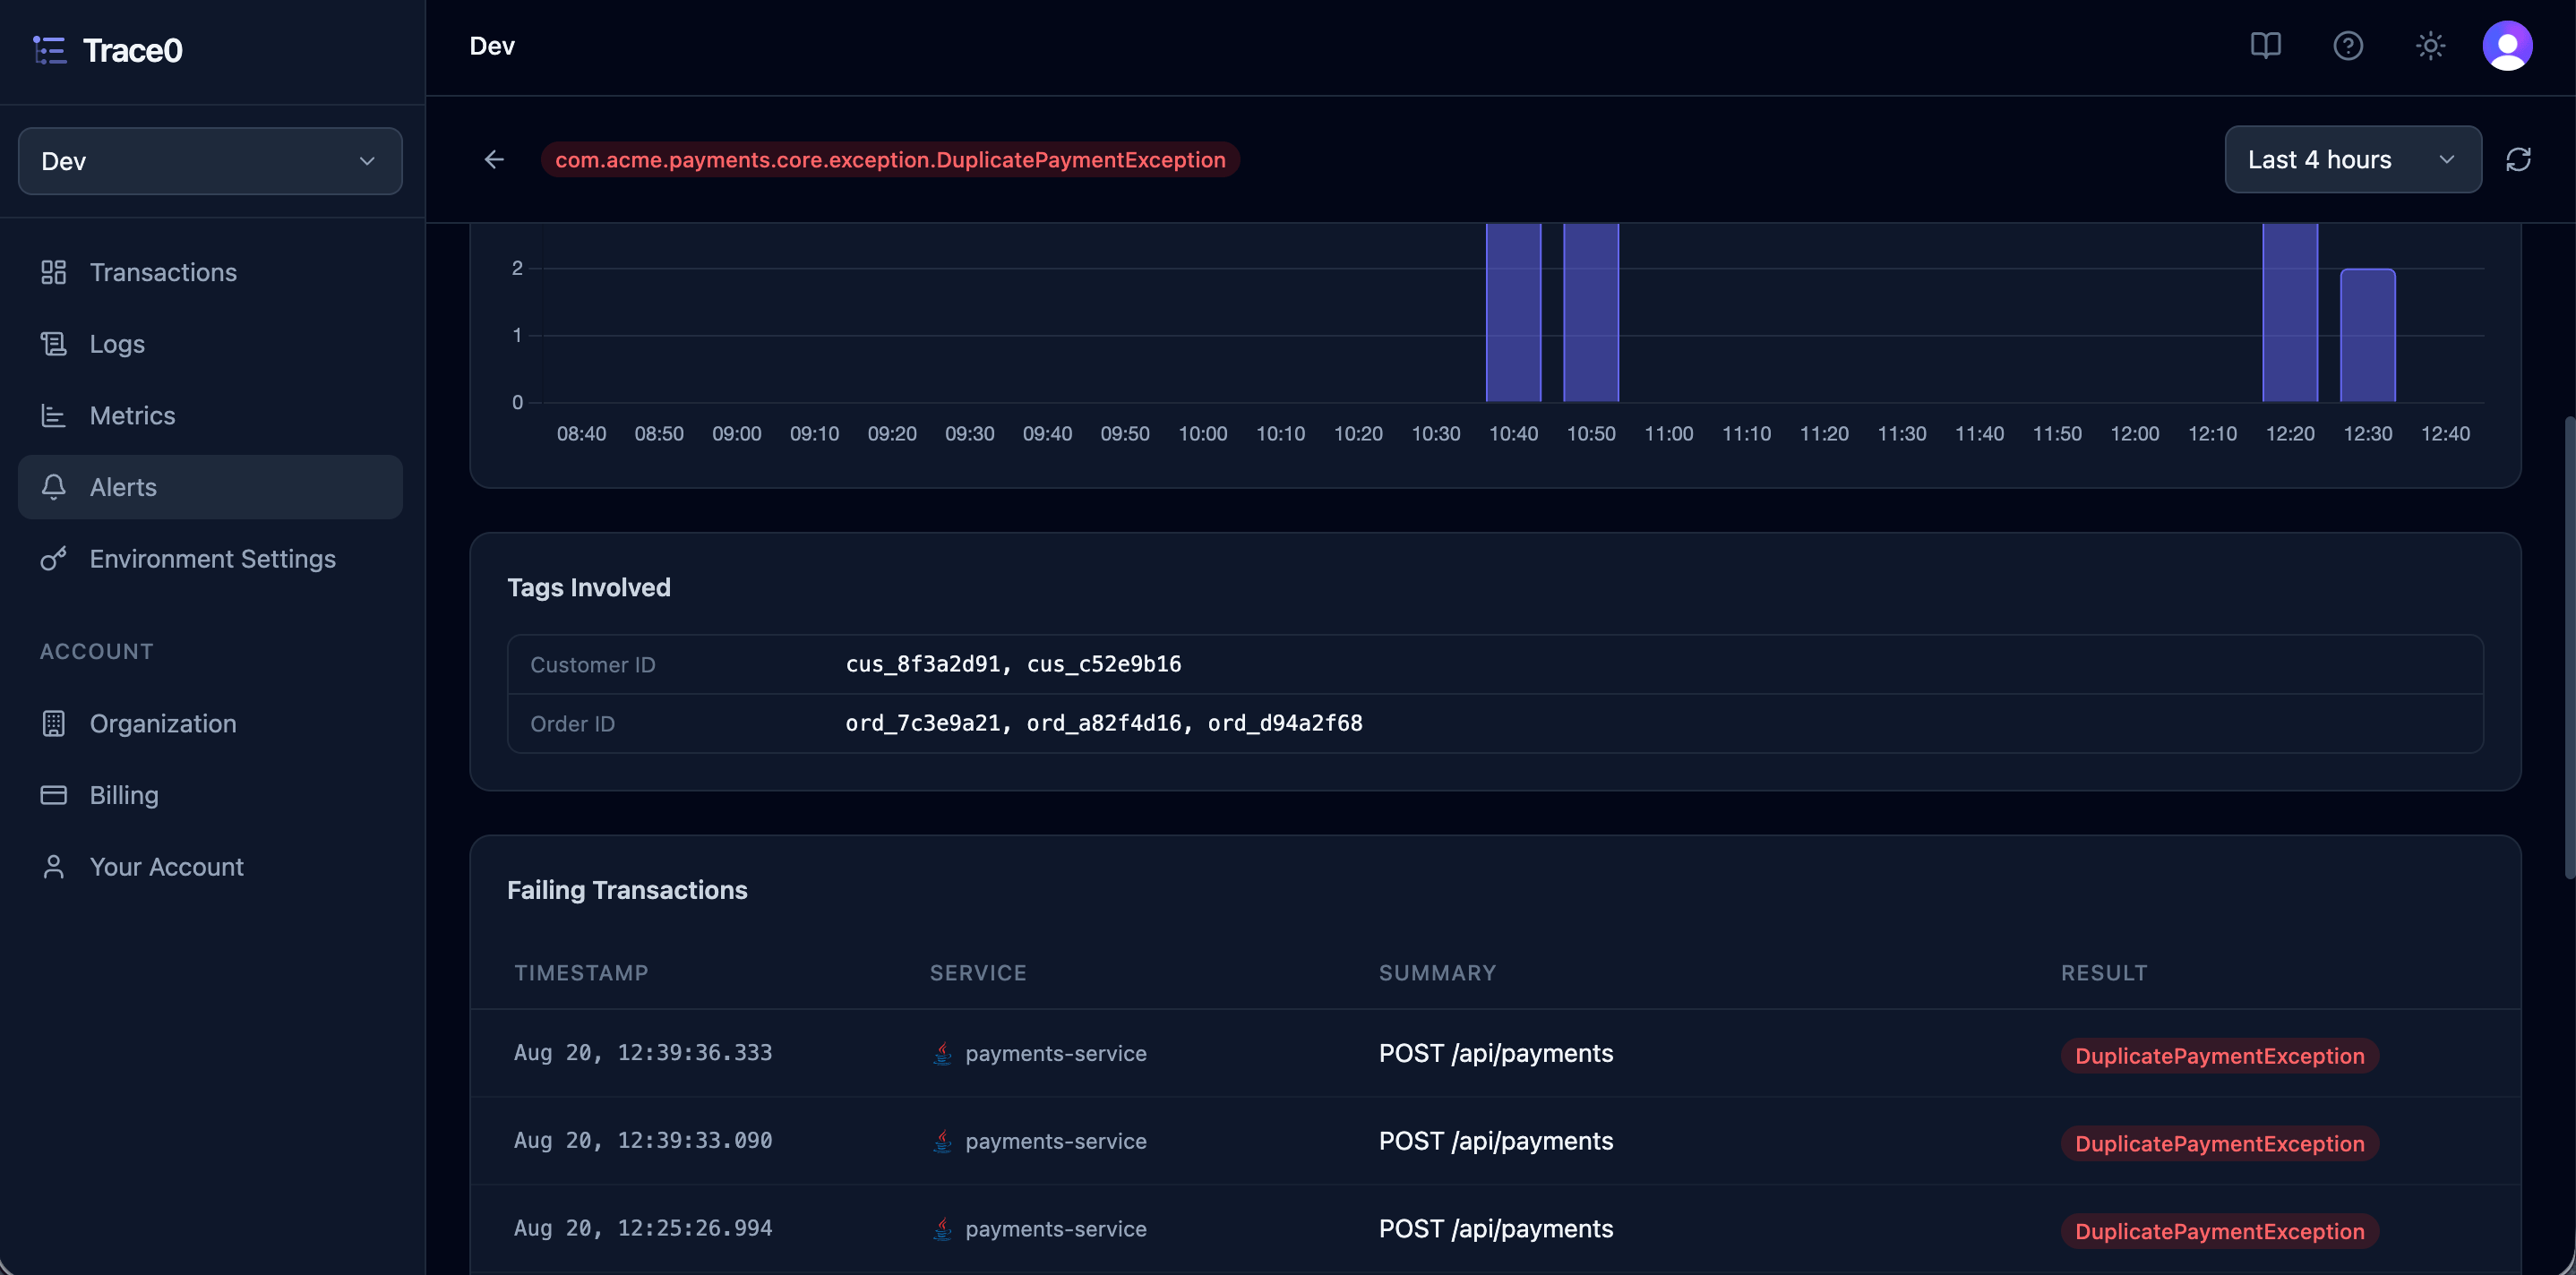
For triggered error alerts, you can view the alert **Volume Over Time**, the [**Tags**](/platform/transactions#tags) **Involved** to understand which users, customers, orders, or other business entities were affected, and the **Failing Transactions** that triggered the alert.
You can then click into a triggered alert to view more details about the alert.
### Error Alert Detail
For triggered error alerts, you can view the alert **Volume Over Time**, the [**Tags**](/platform/transactions#tags) **Involved** to understand which users, customers, orders, or other business entities were affected, and the **Failing Transactions** that triggered the alert.
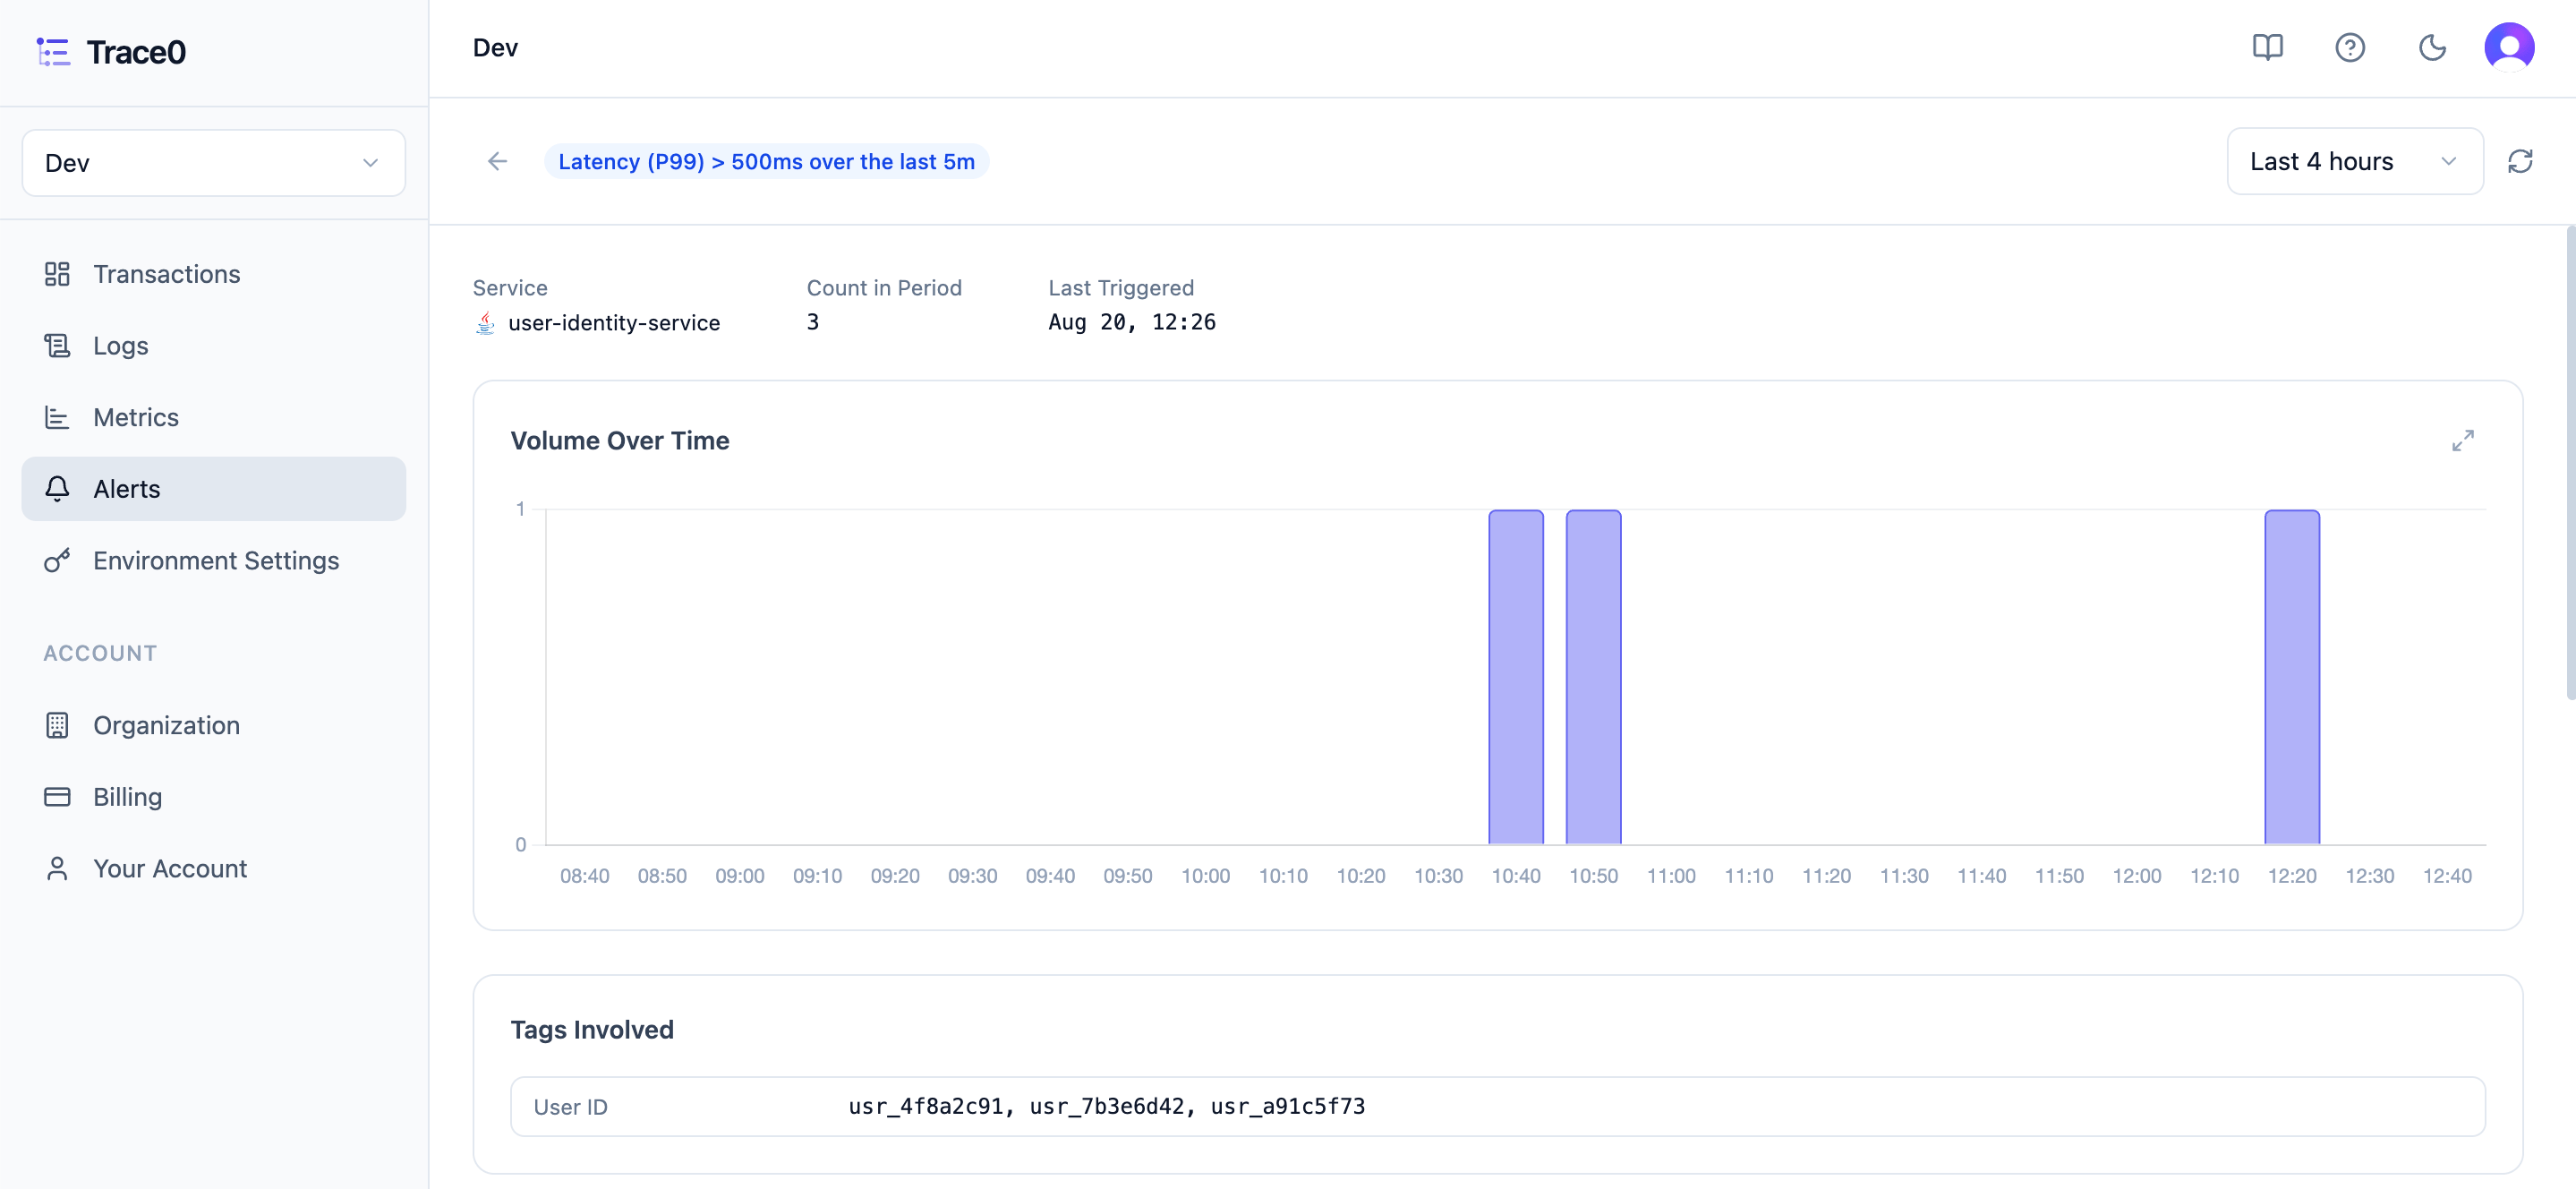
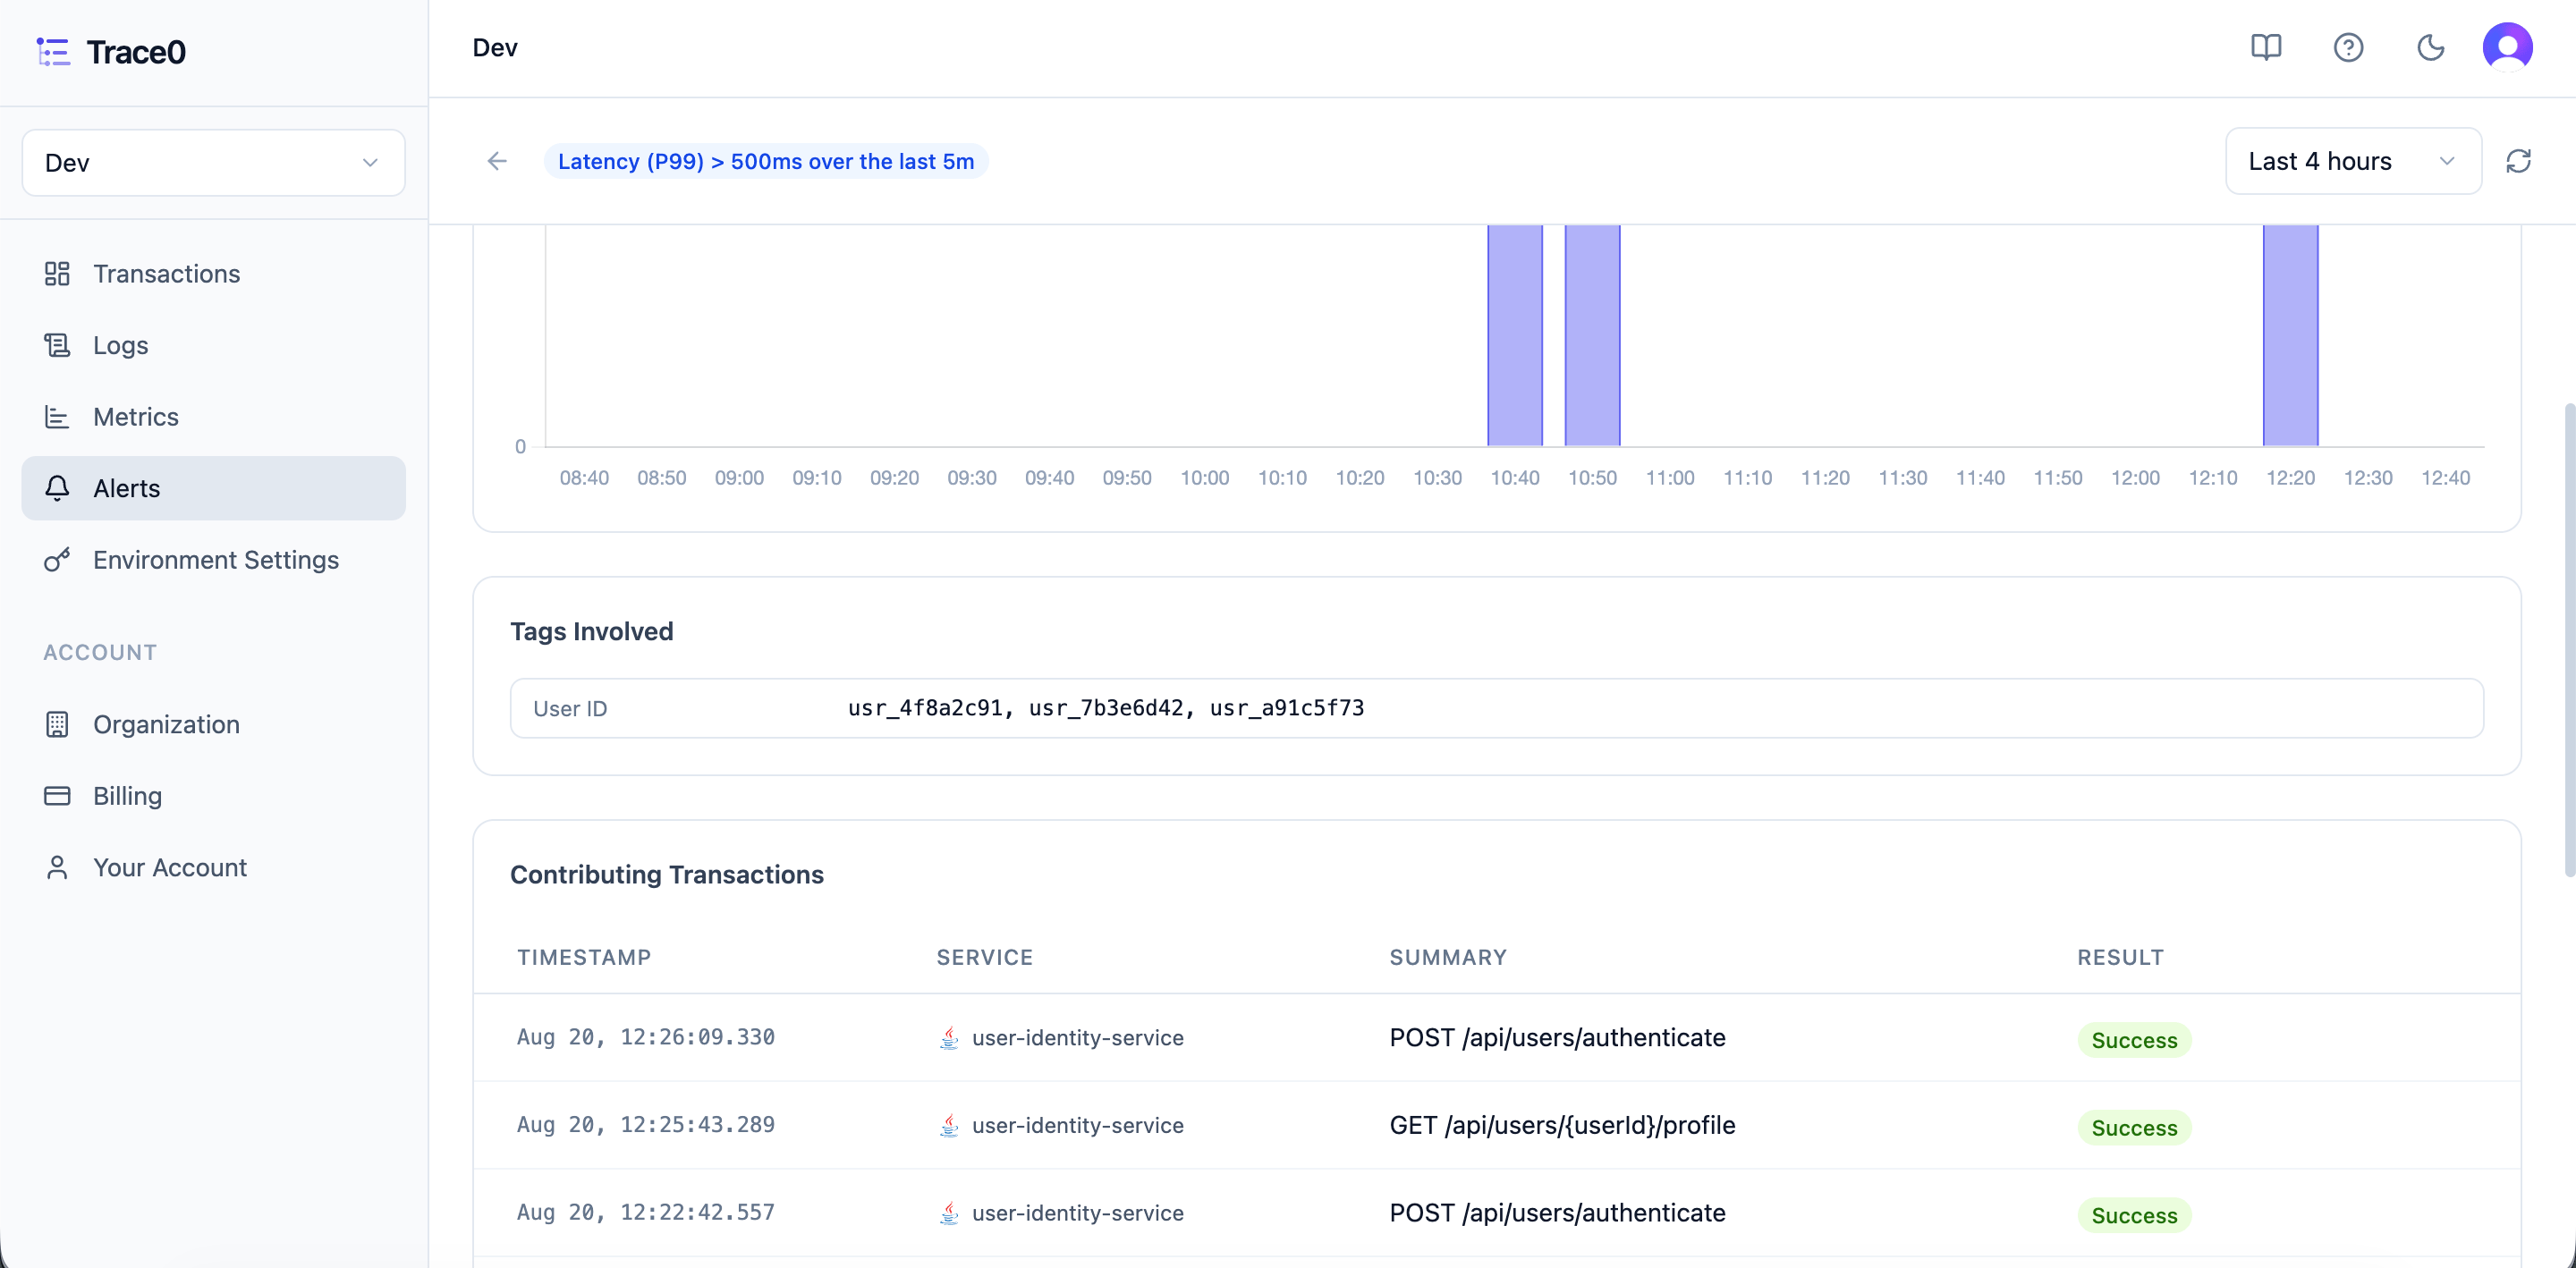
 ### Metric Alert Detail
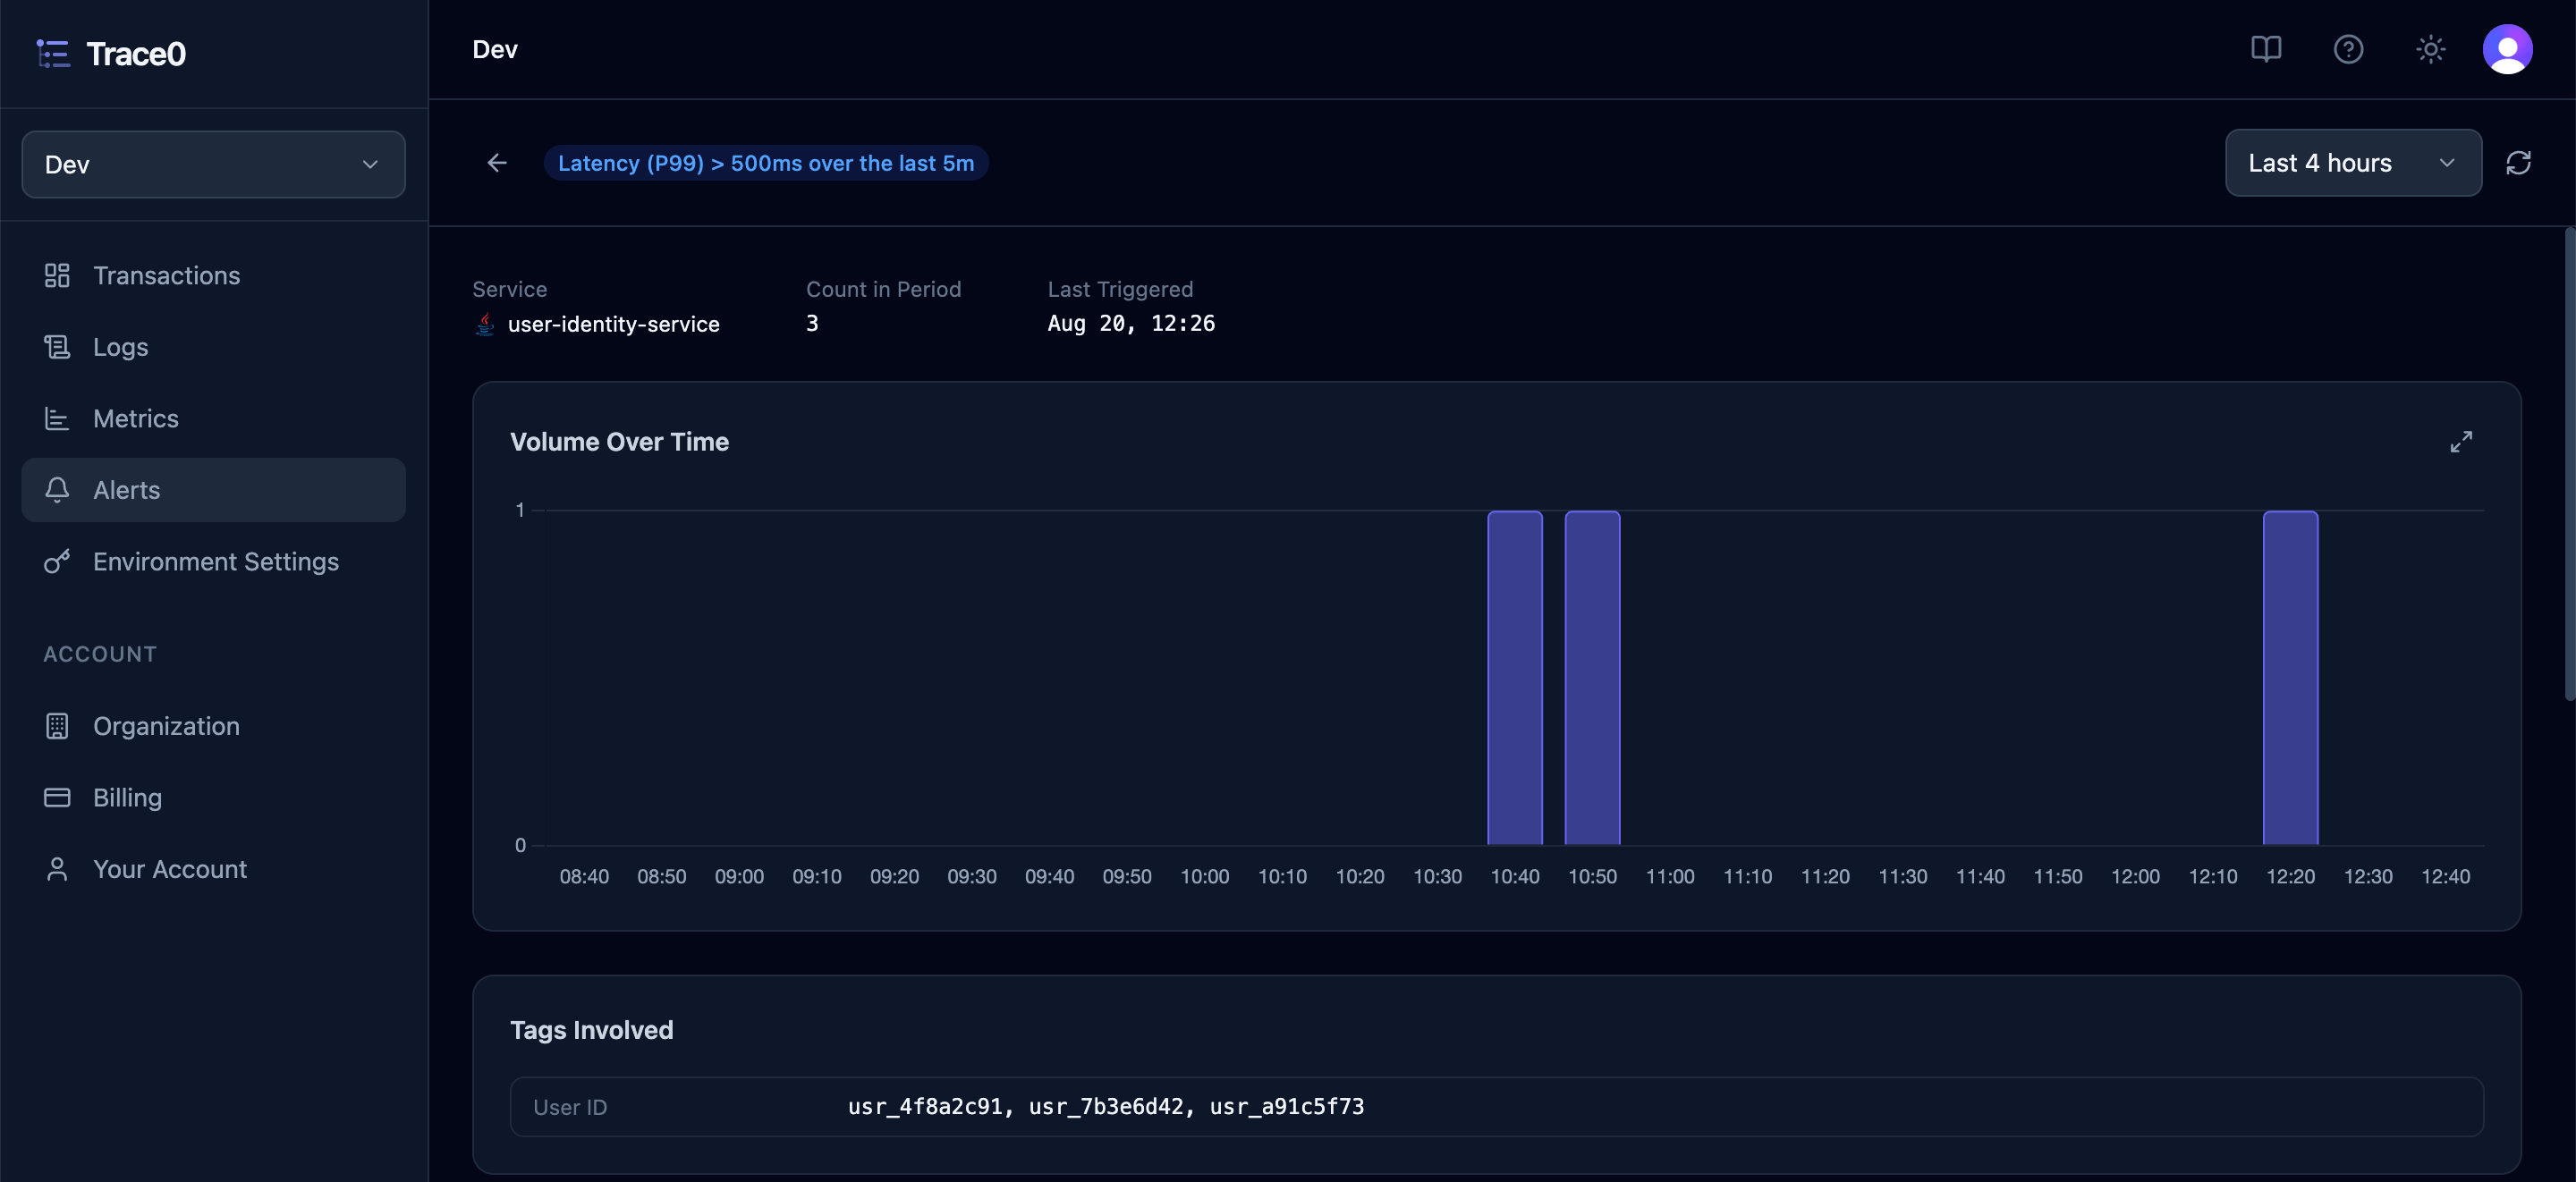
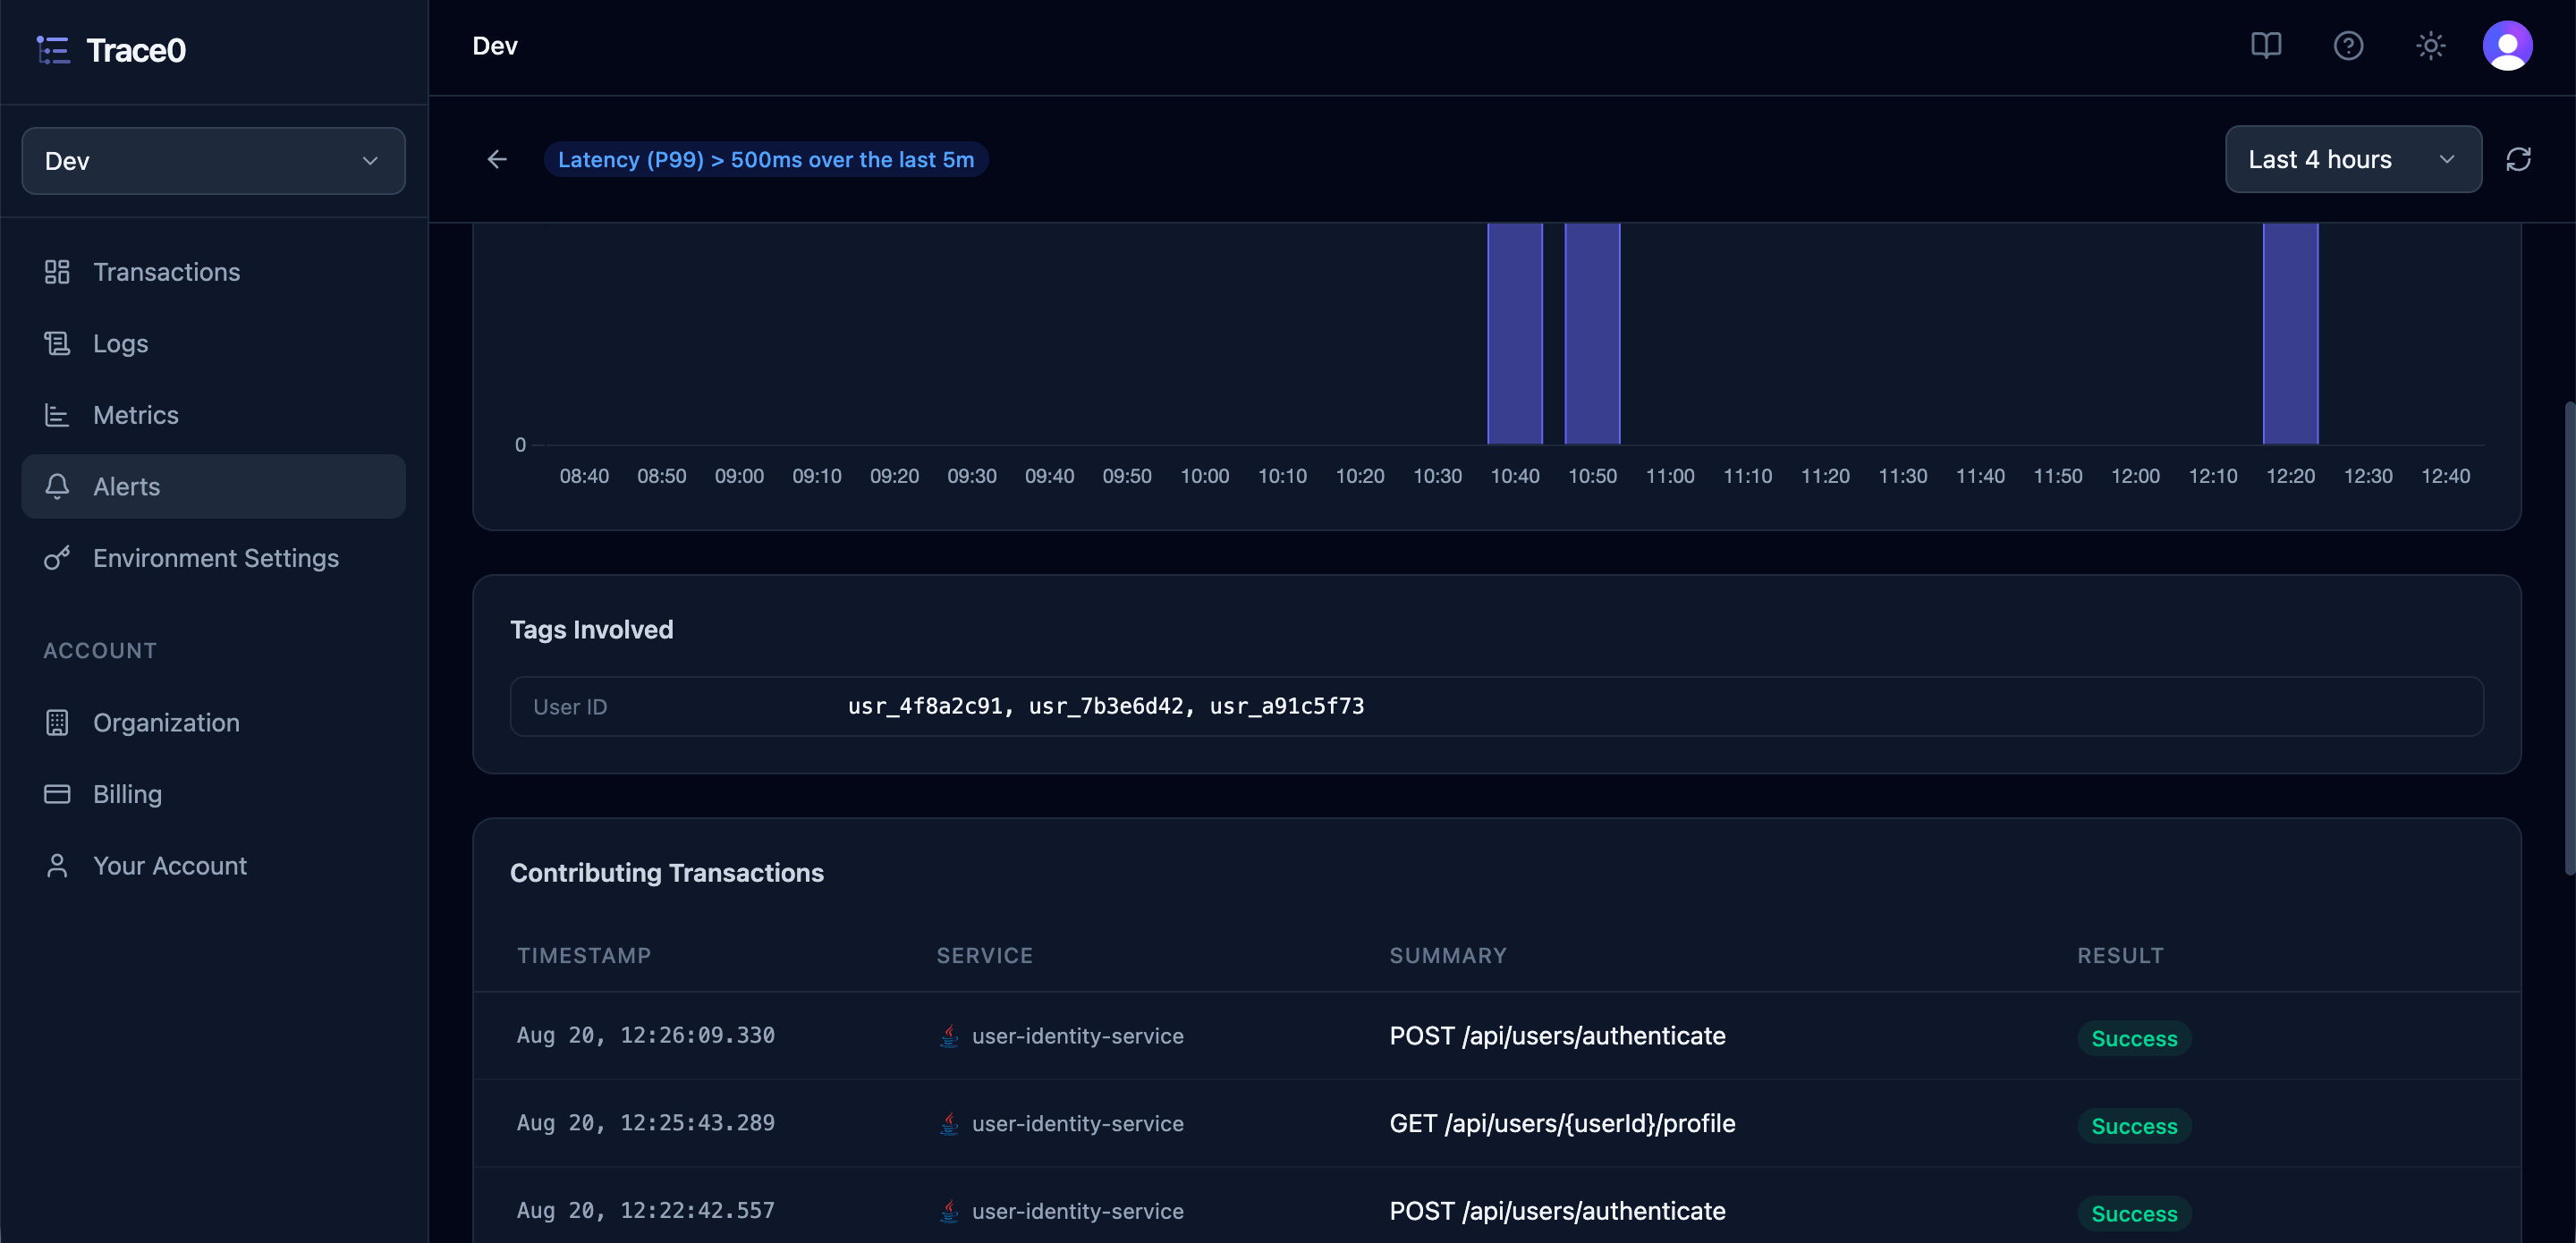
For triggered metric alerts, you can view the alert **Volume Over Time**, the [**Tags**](/platform/transactions#tags) **Involved** to understand which users, customers, orders, or other business entities were affected, and the **Contributing Transactions** that led to the metric threshold being exceeded.
### Metric Alert Detail
For triggered metric alerts, you can view the alert **Volume Over Time**, the [**Tags**](/platform/transactions#tags) **Involved** to understand which users, customers, orders, or other business entities were affected, and the **Contributing Transactions** that led to the metric threshold being exceeded.